
Well, friends, that wraps up the first quarter of 2013. Amazing how fast it has gone! I'm a little disappointed that there were exactly zero buy signals produced by my trading model, but that's just the way it went. I'm not overly concerned because I'm still confident that follow on signals will propel us beyond the DJIA benchmark I have chosen. The good news is that we didn't loose anything either.
All that said, I'm still a bit nervous about this market. Fundamentally, I think things are humming along nicely and the Fed has pretty much focused all of their efforts at raising equity prices and boosting the housing recovery. It appears to be working. However, even the strongest markets have to pull back from time to time. Today's post is dedicated to predicting such an event.
First, my calculated scores:
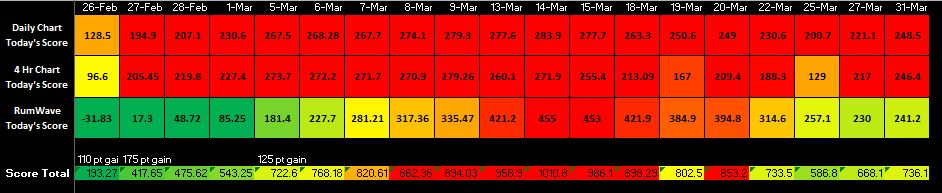
"Score Total" since June '12; hovering around mid range giving plausibility to bullishness or bearishness:

Now for the weekly charts:
DJIA:

What I notice about the above chart is that the RSI is showing a market that is really overbought. Such conditions leave a lot of room for the market to fall if the right catalyst occurs. I also drew a trendline on trading volume. It has been steadily declining, which is a sign of a tired market.
Here is another look at the DJIA weekly chart, this time from barchart.com:

S&P 500:

On the S&P chart above, I increased the size of the Slow Stochastic and MACD. What caught my eye was the Slow Stochastic %D line. It has rolled over, taking a negative slope. I went back and put some vertical hash marks on similar instances in the past. I matched up those hash marks with the MACD and the overall upper chart. The results show that this condition occurs before multi-week declines.
Pictures are worth a thousand words, which is why I like technical analysis so much. All of the above data lead me to the conclusion that a significant event is not far away. My investing ship is in the safety of the harbor for now, and I'll be happy to keep it there as long as necessary to protect it.
GOOD LUCK NEXT WEEK!


No comments:
Post a Comment