Thursday, February 28, 2013

Sequester Shemester

Wall Street to Congress:  you are irrelevant 

It is really interesting that there is virtually no concern about the sequester deadline tomorrow.  I suppose it doesn't really matter until March 1 because federal employees are required to have 30 days notice before a furlough, but still..

I guess we'll just delay the freak out until the end of March when the continuing resolution (band-aid to the lack of a federal budget) runs out simultaneously with the sequester issues.  Have no fear, your elected leaders will ride in on their proverbial white horses to save us, from the problem they created.

I can't make a prediction about tomorrow.. I have no idea.  The charts suggest an up day, I think.  But there's just no way to know.

Scores:

GOOD LUCK TOMORROW!

Wednesday, February 27, 2013

RumWave proven right again

Critical inflection point


Yesterday I posted a comment about an upcoming bullish surge based on historical RumWave data.  It materialized today in a big way.  I don't think it is done.  We may see a pause in the action, but historical data indicates that a 4-5 day trend higher is likely.  This would coincide with an Elliot Wave "5th wave" on the impulse that started in November of 2012.

Today's Scores:

Interesting 1 hr charts with bullish divergences highlighted:


I think tomorrow may meet some resistance, but a stronger short term up and/or sideways trend may be playing out over the next little bit.

GOOD LUCK TOMORROW!

Tuesday, February 26, 2013

Bulls mounting an attack

Ear to the ground, bull stampede on the way


Tonight I took a look at some historic data of the RumWave.  It strongly suggests that a big bullish impulse is coming.. soon.  I believe it will be relatively short lived (a few days), but being caught in a bearish trade will hurt.  After that, I think the downtrend will resume.

Daily scores:

Here is how the DJIA weekly chart is shaping up.. everything is in line with my previous predictions.  We'll see if that red candle stays this week.


GOOD LUCK TOMORROW!

Monday, February 25, 2013

Can the bulls bounce back?

Will the Bulls mount a re-attack?  I think so.

Today was quite an interesting day for the market.  This morning futures were up big as I drove into work.  We opened higher, moved lower, then moved higher again.  However, this was that point I looked at the Russell 2000.. it was getting hammered while the DJIA was in a mild decline.  I tweeted this:


How true it turned out to be.  The rest of the day the DJIA (and DIA) fell out of bed to end up with the worst decline of 2013.

Now, the more important question is, where do we go from here?  Well, I suspect from my calculated scores below that a bullish re-attack is in order.


Here is what the 1 hr DJIA chart looked like at the close today:


You can see that the oscillators are all pretty low.  They could stay there, but I suspect there will be some kind of bounce manana.

GOOD LUCK TOMORROW!

Sunday, February 24, 2013

Weekly trend top intact

Still topping as expected


Friday's rally was not to be unexpected, as I wrote on Thursday.  However, the weekly chart is still in the process of topping. (below)


GOOD LUCK NEXT WEEK!

Thursday, February 21, 2013

Panic

Traders are nervous here

Today's market action continued the selloff that started yesterday until the early afternoon when a strong bullish impulse tried to reverse the trend.  Interestingly, the bullish march was stopped dead in its tracks during the last 15 minutes of trading.  That may have been produced by traders who were itching for a upward move to get out of their long positions.

I've turned on the "yellow light" for two reasons.  1) the top already happened, 2) some folks would be tempted to buy on this weakness.  I'm not buying any long positions because I think there is still more downside to be seen before the RumWave produces a "buy" signal.

Today's scores:

Notice in the daily scores (above) that the RumWave score is in the low double digits and the "score total" color is dark green.  This is an indicator that the market has moved quickly to the downside and a bounce is not out of the question before we continue lower.

GOOD LUCK TOMORROW!

Wednesday, February 20, 2013

Hard selling

The straw that broke the camel's back


What's that you say?  The Fed MAY possibly consider potentially drawing down quantitative easing measures because the economy is getting better?!?  SELL SELL SELL!

Strange, isn't it?  Nonetheless that was the reaction to the Fed minutes today.  It may have been the last catalyst needed to start this giant snowball rolling downhill on the way to the sequestration deadline.  It fits with the weekly charts and the RumWave chart.  I suspect some kind of bounce early tomorrow, but we'll see if it holds.

Today's scores:


GOOD LUCK TOMORROW!

Tuesday, February 19, 2013

Patience

Just waiting

I still have the red light turned on because the RumWave chart still indicates that a decline is necessary.  Waiting can be the hardest part, particularly in this market.  We've seen negligible movement since I turned the red light on, which is in accordance with the red light's meaning.  The red light means that we are not likely to move much higher and profit taking is advised.  The RumWave is not "top-ticking" this market, but I'm confident in my research and trust the trading philosophy associated with it.

Today's scores:

GOOD LUCK TOMORROW!

Saturday, February 16, 2013

30,000 ft view

Weekend scale out of the charts


The last few weekends I've been scaling out the charts to show the trends that are pretty obvious.  I'll do that again this weekend and I'll point out the continued topping of the DJIA.  My calculated scores haven't changed much this week.  I think the flatness of the week has a lot of people guessing whether or not the top is in.  The question du jour is whether or not sequestration talks will frighten investors traders enough to sell the market.

Daily scores:

Weekly charts:

Above is a weekly chart (each candle represents 1 week of time) of the DJIA.  The topping indications are still there.  We see a weaker candle, downward sloping RSI, very overbought indications on the Slow Stochastic, darker green histogram bars on the MACD, and bollinger band %B that is retreating from the 100% level.  All of these indications indicate, to me, that the market is at the precipice of a short to medium term cliff.. a stiff breeze could push it over.


The S&P 500 chart above is similar, but not exactly the same as the DJIA.  The main difference is that the candle for last week is not necessarily weaker than the previous, and the RSI has not rolled over yet.


Above is a weekly chart of the NASDAQ ETF ($QQQ).  I'm seeing the formation of a reliable chart pattern... the head and shoulders.  It is a bearish pattern.  The right shoulder has not yet formed, but this is often a strong signal if it does complete itself.


Last, but not least, is the Russell 2000.  Small caps have had a blockbuster run and have busted out of the pattern they were stuck in.  Last week's candle was not weaker than the previous, but it doesn't take a rocket scientist to see that this thing has gotten "a little to big for its britches" (that's a common Texas saying for my readers in other states or countries that may not get the reference.)

The bottom line is this:  it's been a good run, don't get greedy.  Secure some profits.  Since I turned on the "red light" there has been very little movement either way.  The RumWave has had a pretty strong track record of identifying good times to protect gains.. I suspect this signal will be no different.

GOOD LUCK NEXT WEEK!

Thursday, February 14, 2013

Welcome back, Eurosis

They're baaaaacck.


Europe.  Overnight we learned of disappointing economic data out of the European nations as well as Asian markets.  On CNBC and Bloomberg radio there was quite a bit of talk about a European recession.  This combined with the sequestration talks (an issue near and dear to my heart as someone who will be directly effected) may be just enough to spook the markets into the correction that is so desperately needed.

Today's scores:

GOOD LUCK TOMORROW!

Wednesday, February 13, 2013

When will the bottom fall out?

I'm not short, but I'm ready to be


I'm still waiting for the 20 day SMA to turn over before I make any short term short decisions.  Right now I'm just chilling out with my money on the sidelines cheering on those that may still be making money.  I don't see anything today that screams out a market shift.


GOOD LUCK TOMORROW!

Tuesday, February 12, 2013

RumWave bullish divergence playing out

As predicted, grinding higher before the selloff

A couple days ago I mentioned a bullish divergence on the RumWave chart.  It is holding true as we saw the market grind its way higher today.  I suspect some volatility will return soon.  The weekly chart still looks like it is finding a top so I expect some more sideways movement for a bit.


GOOD LUCK TOMORROW!

Monday, February 11, 2013

Boring day

Blah

Not much to talk about here.  The range bound market continues.  This matches well with the weekend post.   This should be a relatively calm week if we are seeing the top.  Of note, today's action was on the lightest volume of 2013 for the SPY.  It seems like everyone is in "wait and see" mode.

Today's scores:

GOOD LUCK TOMORROW!

Saturday, February 9, 2013

Still choppy

Big Picture Look

Hello again readers!  Sorry I missed Thursday night's post.. some other stuff came up of higher priority.  But, I promise to make it up to you with lots of great charts today!  Overall, the big picture view looks slightly scary, but the shorter term view looks like we may see a little more volatility in the market as it melts up a little higher before a larger pull back.  Allow me to explain.


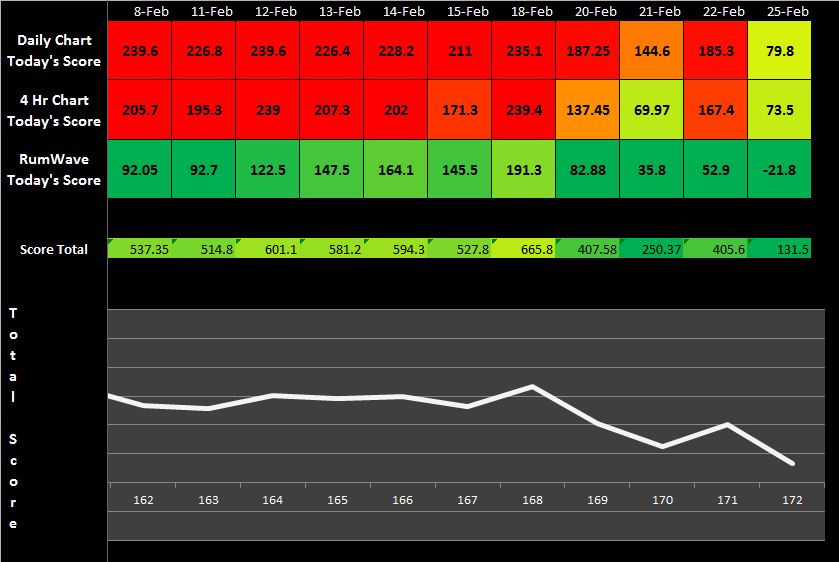
In my daily scoring system (above) you will see that the RumWave score is quite green.  This would normally indicate an increased probability of a move to the upside.  However, my criteria for purchasing long positions has not been met, and it would take a very big move to the downside to turn on the "green light."  Oddly, there is a little bit of a BULLISH divergence (yes, bullish) on the RumWave chart.  I'm going to look back to see if this has happened previously, but for now it indicates that a short term move higher is not out of the question.

 Long term chart views:

Above is a weekly view (each candle represents one week of time) of the Dow Jones Industrial Avg.  Regular readers will recognize my favorite phrase, "don't outsmart your common sense."  This looks like a chart that is ready to roll over to me.  One of the big warning flags that I see is a Heikin Ashi candle that is showing a decrease in momentum.  Another big warning flag is the RSI is turning downward from a very "overbought" level. 


The chart above is a weekly view of the S&P 500.  Same thing as the Dow, it looks ready to turn over, but it doesn't show signs that it has already started.  The RSI is still sloping upward.


Above is a chart of the NASDAQ.  This one is really interesting because the QQQ has not participated in the 2013 rally as fervently as the rest of the averages.  At the same time, the Slow Stochastic of this average is pegged at a very high level.  This suggests, to me, that when this thing goes down, it may go down pretty violently.


Last, we'll look at the Russell 2000.  It is an index of small cap stocks.  I like to look at it because I've previously observed the small caps leading the large caps lower.  If we are able to see that happen, it can give us a "head's up" that the major averages may be about to roll over.  So far, the Russell 2000 has not shown signs of turning over, but the candles are showing a drying up of the momentum, and the oscillators at the bottom of the chart are all firmly in overbought territory.  However, this has happened before.  You only have to look at the left half of the chart to see the Sep '11 to Apr '11 run.  The RUT, in that case, rode the high oscillator level for a long, long time.

GAMEPLAN FOR NEXT WEEK:  Remain nimble, occasional tactical level (short term) gamble plays, but no strategic (long term) long or short positions.

GOOD LUCK NEXT WEEK!

Questions or comments?  Email me:  rumwavetrading@gmail.com 

Wednesday, February 6, 2013

Still Choppy

Not much to speak of

This morning I exited my bearish option play shortly after the open with a modest 10% gain from the overnight movement.  Bulls are still buying up the dips.  I can't say with certainty when the big move to the downside will happen, but I still think it will be sooner rather than later.

Daily Scores

GOOD LUCK TOMORROW!

Tuesday, February 5, 2013

Chop Chop, Top Top

Chop Chop, Top Top

Surely I'm not the first one to come up with that rhyme!  Nonetheless, I think it holds true and is a good description of what the market seems to be doing right now.  Today the DJIA didn't break above Friday's highs.   Instead it bounced right off the same resistance level.  In the last 10 minutes of trading today I saw (on 30 minute candles) some oscillators turn over to the downside, so I purchased a few PUT contracts on the DIA.   I'm looking forward to seeing how the futures look when I wake up tomorrow!

By the way, I downloaded the CNBC alarm clock app.. I love it.  Becky Quick wakes me up each morning and tells me if the futures are up, down, or neutral..  There are worse ways to wake up!

Scores:

TSP :  G fund
IRA / 401k:  Very cautious here, I'm in very safe plays

GOOD LUCK TOMORROW!

Monday, February 4, 2013

Volitile

Topping 

Topping patterns tend to ungulate around a little before the bulls run out of steam.  We're seeing that happen.  I suspect that the bulls aren't quite ready to give it up just yet, so we'll see if there is any fight left in them tomorrow.  If they get smacked down, I'll give some strong consideration to starting a short position.  For now, the scoreboard is showing a DJIA 3x short ETF, although I am not personally invested in it yet.


GOOD LUCK TOMORROW!