Tuesday, July 31, 2012

An orderly pullback

Not too bad so far


For now, we have seen a gentle pullback leading into the Fed / ECB news over the next two days.  That bodes well for the market.  It tells me that we are not going completely crazy over anticipated QE, and that there is a little caution in the air.  The internal numbers of the calculated scores below came down off the "red" ranges, but the overall scores are still pretty high.  I still think we could drop 100 pts in a heartbeat with the right headline.... something to the effect of.. "Fed fails to deliver anticipated QE".


The first red candle showed up today.  Notice the slope of the candles from the last wave.  It has been my experience that the greater the slope is going up, the greater the slope is going down.  It looks like we would meet resistance (top of the last wave) in the vicinity of 12900, so I would not be surprised to see it drop a little below that and then claw back up to close above that resistance level.


The daily candlesticks have taken on the "twisted ribbon" appearance that signals an end to the momentum.  I've seen the market break both higher and lower from this point in the past.  The slow stochastic would indicate that there is less resistance to the downside over the next couple days, so that is what I think will happen.

If it does drop a bit, I won't be in a panic because the RumWave tells me that we will continue higher and this is just a brief (and necessary) pause in the action.  

GOOD LUCK TOMORROW!

Monday, July 30, 2012

Pullback is in order

Pullback needed


Today's action was a non-event.  Everyone is just waiting to see what happens with the Fed and ECB this week.  A speculative rally might hit tomorrow, but that will send the daily scores into the red.  Below we can see how the 4 hr score is at the point at which it has traditionally pulled back.


The 4 hr candlesticks are showing some signs of consolidation.  The Slow Stochastic, %B, and RSI all favor a temporary decline.


For the daily chart above, I changed the candlesticks to a traditional depiction versus the Heikin Ashi ones I usually post.  I changed it today to display what may be a tweezers top.  Such a signal would indicate a trend reversal.

Overall, I will keep my positions where they are.  There is the slight chance of an ECB inspired push to ridiculously overbought levels and the RumWave is still showing a positive trend for the next week or two.

Best of luck tomorrow!

Saturday, July 28, 2012

Big expectations

Big expectations can lead to big disappointment

The world's markets are rejoicing over expectations that the ECB and/or the US Fed will announce some kind of stimulus next week.  Wednesday will be Fed day and Thurs will be ECB day.  The last few days' rally has been great, but we are getting to a point of resistance from a technical oscillator perspective.  The calculated score for the 4 hr chart popped two red numbers on the internals with an overall dark-orange score.  The daily also turned orange with no pink or red internal numbers.  So, based on previous scores, it would be logical to expect 1-2 more days of upward momentum before some kind of minor pullback.  This would coincide with the expected Fed / ECB news.  Big expectations without a payoff lead to big disappointments.


DJIA 4 Hr Chart
Slow stochastic and %B are pretty high.  That should be a little natural resistance.


DJIA Daily Chart

The Slow stochastic on the Daily chart is not as high, and has room to go higher.  However, the %B is above the 100% level, indicating that we are at the top of the Bollinger band.  We could ride it up, so to speak, but I think some cooling of momentum is in order.

GOOD LUCK NEXT WEEK!


Thursday, July 26, 2012

Euro-Hope to the rescue!

So close to perfect timing, but not quite!

Yesterday I wrote that some kind of good news about Europe would spur the market for the next up wave.  I had anticipated it would happen over the weekend, but it happened in the early morning hours (in the US anyway).  Literally, in the 30 minutes it took me to get ready for work the market futures swung from -30 to +145 on words from Mario Draghi that he would do whatever is necessary to save the Euro.  That headline was all we needed to be off to the races.  The RumWave had been predicting the pop and continues to show the path of least resistance to be "up" for the next 10-20 days.  That doesn't mean it will be a straight line; we will have a couple pauses and pullbacks along the way but I think my long positions will be better off in mid-august than they are today.  The RumWave and UltraWave will both reflect a 3x DJIA Bullish ETF for this wave.


If you didn't get in today, I think you still can tomorrow based on the 4hr and Daily scores above.  They took on a slight orange tinge today, but nowhere near red and the internals that go into calculating the scores are not showing any pink or red numbers as a result of today's tremendous climb.


 The 4 hour chart shows room to climb still on all of the oscillators below the candlesticks.  The RSI rocketed into overbought territory, so a relatively flat (or even slightly down) day tomorrow would not be beyond the realm of reason.  If that is the case it will be a good buying opportunity.


The daily chart also shows room to climb across the board.  I think this will be the end of the summer swoon and we will climb the rest of the year... right up to the fiscal cliff!  The Dow has some catching up to do if we are to make our statistical annual average percentage gain.  I tend to believe that the big money will start pushing pretty hard the rest of the year to make that happen.

Best of luck to your trading!


Wednesday, July 25, 2012

Rotate into bullish positions

Window to buy bullish ETF open

The opportunity to rotate into a bullish ETF is here.  We should have Thursday and Friday to buy in.  The RumWave is not quite at a perfect bottom, but it is close enough to turn on the green light.  A likely scenario would be some kind of "good news" about Europe over the weekend spurring a large move that kicks off the whole thing.


The scores for the 4 hr and daily chart do not show a perfect opportunity yet.  From previous rallies we would expect two more days of decline before a snap higher.  However, I don't want to be late to the party so I will rotate out of my 3x Short DJIA ETF and into my 3 x Long DJIA ETF for both the RumWave and the UltraWave... especially if we get some decline tomorrow.  The short position is near a break even point, but I will probably take a bit of a loss (1-2%).  I suspect the next up-wave will be a strong one that breaks us out of this channel we have been in.


The 4 hr chart has some little green candles, but the slow stochastic still has some room to cool off before a big run up.


The daily candles aren't really showing a strong reversal of momentum signal, and the slow stochastic has some room to decline.  The RSI is on an uptick, but if I were a betting man I'd expect it to turn down just a bit, similar to what happened around 25 Jun, before we really take off.

If you like the content of this blog feel free to visit our sponsor sites, it will help keep all this content free for everyone!

GOOD LUCK TOMORROW!

Tuesday, July 24, 2012

TEQUILA!

Couple more down days probably

First, HAPPY TEQUILA DAY!  What a great holiday for my favorite sipping beverage.  

Now, on to business.  Tomorrow it will be Fed rumors vs the world.  On the bullish side we have reports that the Fed could announce stimulus plans next week.  That was the impetus for the end of day rally today (along with being pretty oversold).  Fine.  Lets see what the bears have on their side.  Spanish 10yr bond above 7.6% = bearish.  Questions about Germany's ability to maintain it's promise to save everyone = bearish.  Moody's cuts outlook on EU stability facility to negative = bearish.  Apple earnings disappointment = bearish.

We'll see who wins out, but the RumWave and the daily scores (remember, they are two different means to measure the market) suggest at least one more down day, and probably two before we adopt a bullish stance.


The 4 hr chart looks like it needs a little reprieve, but the purple line of the slow stochastic needs to catch up to the red.  Bearish.


 Strong red candle and ample room to decline on the slow stochastic.  Bearish.

Overall, I'm ready to abandon the short positions for the UltraWave in the next couple days and rotate into the 3x Long DJIA ETF that I prefer.  However, the signal isn't here yet!

GOOD LUCK TOMORROW!


Monday, July 23, 2012

Still room to the downside

There's still room to go.  Not time to buy.

The daily scores show a very green RumWave score.  However, it is not time to buy.  I think I need to re-calibrate the green return for that one.  The 4 Hr and Daily DJIA chart scores are cooling off.  I think there is still significant room to decline.  It seems likely to continue all this week, as the Euro panic just kicked off again.


My interpretation of the 4 hr chart is that we may get a little pause in the decline, but  the red and purple lines on the slow stochastic have ample room to run down.


Today was the first red candle on the chart (these are Heikin Ashi candles, not standard ones).  There is plenty of room to decline on all of the oscillators below the chart.  

Bottom line, there is still downside ahead.  

Best of luck tomorrow!

Sunday, July 22, 2012

Looks like we're going down

Restarting the downtrend

Friday's action started the downtrend again.  The RumWave indicators are kind of split on the remaining time of the decline.  Overall, I think we will be down for the rest of the month.  I can't say what the magnitude of the decline will be.  However, the potential is there for it to be a violent swing down.


The RumWave score turned quite green but it is not signaling time to buy yet.


The most interesting thing of the 4 hr chart is the bearish divergence between the candlesticks and the MACD.  It's not a jump-off-the-screen signal, but I think it is there.


The daily chart is just showing the start of the trend breakdown.  A down day Monday will turn the candle Red.  

As I write this I'm getting CNBC text alerts that Asia is down on renewed Spanish debt fears.  Europe has been pretty quiet the last week or so.. too quiet.  

 Best of luck this week!

Thursday, July 19, 2012

One more day

I'll be glad when this week is over

China stimulus hopes.. done.  Bernanke hopes x 2... done.  First week of earning season... done.  I'm ready for some downside to help out the UltraWave positions.  Obviously the 4 hr chart is in the red.  The daily isn't, but it is orange enough.  

Short post tonight because I don't have much time, but lets see the if the bears can put on a show.

Good luck tomorrow!  


Wednesday, July 18, 2012

Bulls showing strength

Bulls are showing strength, but I'm still not convinced

I don't want to sound like a perma-bear here, but I'm still not convinced in the longevity of this rally.  Those that have been long have made some good profits and I can't argue with results.  However, I think they would be wise to start taking profits.  The scores for the 4 hr chart are showing some red numbers on the internals.  If it follows the same structure as the previous downturn, we have one more up-day to go before a sizable move down.   Last time (6 Jul) we saw a 190 point drop at its lowest point of the day.

I'd like to emphasize that the RumWave is a forward looking tool that is void of emotion.  It still favors a decline in the not-so-distant future.


Daily Scores


4 hr Chart

The 4 hour chart itself is showing some good strength.  About the only thing that is looking bearish to me is the Rate of Change indicator.  RSI is high and will probably decline soon.

Daily Chart

 The daily chart is showing some good strength as well.  Today's candle is a strong one.  One could make a bullish case that there is more room to climb on the red line of the slow stochastic.

Best of luck to your trading!

Tuesday, July 17, 2012

Beware of Bears

Bears are lurking

This afternoon I reviewed the RumWave trading method as far back as 2005.  It has never returned to a bullish pattern from its current state without some kind of further decline.  I'm not sure what the catalyst will be, but storm clouds are on the horizon and I hear thunder in the distance.  Euro headlines have been quiet for a seemingly long time, maybe it will flare up.  Also, the first week of an earnings reporting period (this week) is usually the best.  After that the market averages usually fare worse.  


What I find particularly interesting with the daily score is the 4 hr score compared to the RumWave score.  If we look back at the previous times it reached the orange level, we saw a large decline within a couple days.  On the last decline, which was a RumWave peak, the RumWave scores were in the red.  My interpretation of this data is that we are near the peak of this brief impulse higher and will return to the bearish trend in the near future, continuing the RumWave chart decline.


The 4 hr chart actually is showing some good bullish strength signals.  I believe these to be false hopes.  It is these kinds of indications that will cause some investors to go long here.  If the RumWave holds true, those investors will be hurt in the near future by that decision.  An opportunity to get bullish is not far off, it just isn't right now.


The daily chart is also showing some good strength.  Again, I'm not betting on this continuing for too much longer.

If you are a regular visitor of this site, thank you!  You can help keep this information open to all by visiting a sponsor's link on this page when you read the blog.

Best of luck to your trading!

Monday, July 16, 2012

No stimulus yet

No signs of China stimulus

There were no signals of China stimulus on Sunday or Monday.  In my previous post I has stated that a lack of stimulus would likely lead to declines today. The market was only down marginally today, but I think it would have been worse if we didn't get to see Ben Bernanke in the spotlight a couple times this week.  The stimulus fans will be hanging on his every word looking for further easing, but I find the chances of that slim.  Earnings will really start coming out this week.  We'll see how the market reacts, but the RumWave chart (that I don't post) still shows ample room to decline.


The most interesting thing on the daily scores is the RumWave score, which has taken a bit of a greenish tint. It still doesn't signal time to get into long positions, however.  


What I find interesting about the 4 hr chart is today's candle.  It shows a shoring up of momentum to the long side.  Also, the RSI has shown some decline here, and has room to go down quite a bit.  The %B is also showing a declining slope.  


The daily chart doesn't really say all that much, except that bearish divergence that we had already discussed.  Friday's rally was contrary to that indicator.

I look forward to seeing how it goes tomorrow.  Best of luck to your trading!

Saturday, July 14, 2012

Reasons I'm not changing my positions

Friday's action was a nice big fat short-covering rally that rocketed the Dow up more than 200 points.  The catalysts were two fold.  Setting the stage was the 4 hr daily chart score that I calculate.  It was very green and favored a move up.  Then, the Chinese economic data spurred the "bad news is good news" crowd on hopes for Chinese stimulus.  Boy, these stimulus junkies are desperate for something.. anything.. to get the market moving back up.  The potential for a big up move (on Monday) caused a massive amount of short covering and we were up, up, and away.  The decision on China stimulus is expected on Sunday.  If it doesn't happen, or if it's not as big as the whisper number, look out below.  This could turn out to be a classic "buy the rumor and sell the news" event.  
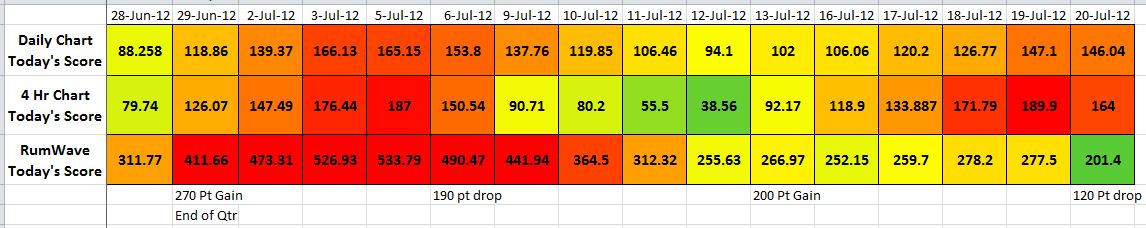
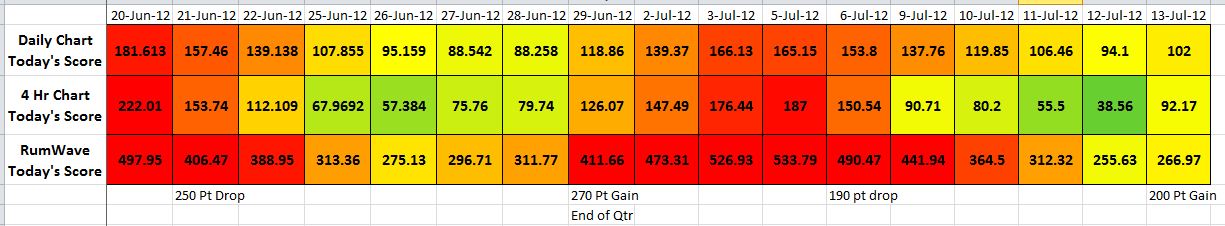
Daily Scores

The daily scores performed as we would expect on a big up day.  The 4 hr is back in the yellow after a very green number Thursday.

Before we get into the rest of the charts, I'm going to outline a couple reasons why I'm not convinced that this rally will carry on for very long.  First, the RumWave is at a mid range point on a downward slide.  All I can really do is compare where it is now with historically similar instances and draw the most informed conclusion possible.  The conclusion that I have reached is that in past examples where the RumWave looked very similar, the best move was to stay the course.

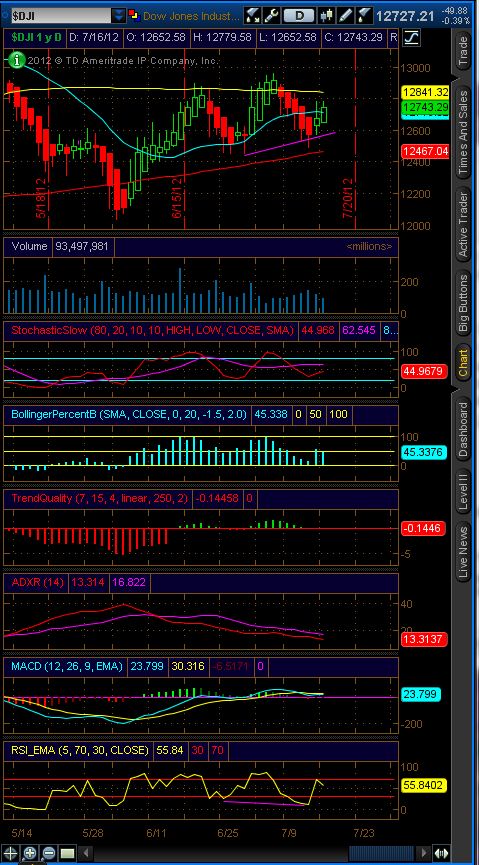
Below is an example of the DJIA from 1 Nov through 25 Nov 2011 (the highlighted white rectangle on the chart shows the dates mentioned).  The RumWave provided a sell signal just prior to 1 Nov, and we got a couple red candles downward.  Over the next 10 or so days, the market rallied.  During that time, the 3x inverse leveraged ETF that I use was down as much as 12%.  During that entire time the RumWave scores were decreasing as the market moved higher.  Then around 15 November the market snapped lower.  During this time the inverse ETF made up some serious ground.  On 25 Nov the RumWave signaled a reversal of direction (which correlated perfectly with the bottom) and the ETF had achieved an 8% profit.  I give this example because the RumWave looked very very much like it does now.  What that means is that I'm in for some pain on the UltraWave for a little while, but I have faith that the RumWave indications will hold true.  There is no such thing as a crystal ball in this game, but the RumWave is the closest thing I've found to it.  The RumWave, unlike us mortal humans, is not subject to emotional swings that come from big market moves against us.  That is one of the reasons it is so great!

DJIA 1 Nov - 25 Nov (white shaded box)


McClellan Oscillator
Above is another tool that RumWavers need to be familiar with.  It is called the McClellan Oscillator.  The chart is provided by StockCharts.com, and the definition if from investopedia.com.  It doesn't take a rocket surgeon to see what is going on here.  When the chart shows very high numbers, it reverses back down to lower numbers.  In a very broad, unscientific sense higher peaks usually return to lower troughs.  Currently, the McClellan Oscillator is only at mid-range after a very high peak.  This is a warning that Friday's rally may not be one to hang your hat on.


DJIA 4 Hr Chart


Above is the 4 hr chart.  It was a big strong rally that will likely carry some momentum with it in the next week.


DJIA Daily Chart

The daily chart is also just what we would expect on a big rally.  We will see how it plays out over the next week or so.  


I expect this week to be grueling on my inverse positions, but I'm going to ride it out with the faith in the RumWave trading method.  It has always been right, as long as I listened to what it was telling me and set my emotions aside.  Best of luck to your trading!