Saturday, September 29, 2012

Bottom is close

Bottom is close, scale in if desired                                      NEW POLL------>

(Updated Sunday, 2 pm CST for an incorrect chart)
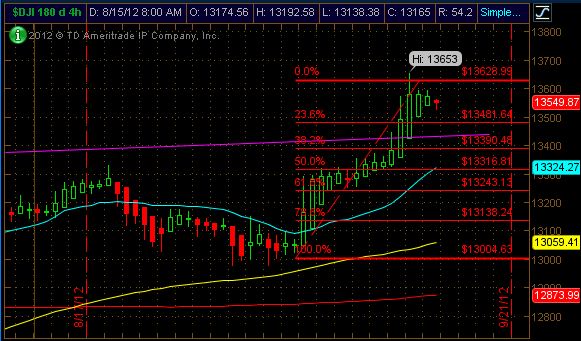
The stoplights are a little confusing but in this post I'll show you why I think there are only a couple more trading days before a move higher gets underway.  The RumWave chart and my daily scoring system both show the market pretty close to a bottom.  There are no crystal balls in this business, but everything would be nicely lined up for a move higher if we had one or two more down days (about 150 - 200 Dow points).  That said, the market has bounced off current levels in the past, so it is not beyond the scope of reason that it could take off at any time.  For that reason, I recommend scaling into your positions here if you are investing a significant amount of cash, especially if we see declines.  If you are playing with a small lot (I'm talking 1-2k) you'll probably be happier just to wait another day or two.  Here are the end of day numbers for Friday:


Here are the daily scores.  Notice the dark greens.. that's a good thing for bulls.  The daily score is still a bit high being that burnt orange color (go Texas!).


 Above is a side by side comparison of the Dow Jones Industrial Average (left) and the Euro-US Dollar currency pair (right).  If you ever doubted that our market moves in tandem with the Euro.. here's your proof.  Both are finding a little support along their 20 day moving averages (blue line) and for the Euro, it also coincides with a 50% Fibonacci retracement.  The takeaway from this is that a weak US dollar = stronger apparent stock market.  I say apparent because your actual buying power is reduced in the process but it at least makes you fell like you have more money in your account, and that is the stated intent of the Fed's latest stimulus plan.  Good news for market bulls.
Above is a depiction of a Head and Shoulders chart pattern.  For those readers who are unfamiliar, it is a very popular signal for those that like to read charts.  Now, lets take a look at the S&P and Russell 2000 charts on a 30 minute scale (each candle represents 30 minutes of time).


Did you see the Head and Shoulders patterns that developed the last three days?  From this, we would expect a move lower that targets the 1420s region on the S&P.  That would be about 20 S&P points and based on my general multiple of 10 correlation between the Dow and S&P, 200 Dow points.  This is the move we need to get a strong bullish impulse started.

Questions, comments about the blog?  Email me: rumwavetrading@gmail.com

GOOD LUCK NEXT WEEK!

Thursday, September 27, 2012

Almost a buy signal, but not quite yet

Almost there, but not yet.

The RumWave is close to a buy signal, but there is one key component missing so I'm not recommending getting long just yet.  I think another brief downward impulse is probable before the real turn higher.  I'll le you know if something changes my mind.  Today's scores:


GOOD LUCK TOMORROW!


Wednesday, September 26, 2012

Bulls need to fight back here

Bulls need a win here

Reviewing the scores below, the bulls look like they are poised for a little fight back.  The 4 hour score is very very low which gives the bulls the fuel they need to rocket up some.  However, the daily score still lends itself to a general move lower over the short term and so does the RumWave.  The RumWave is closer to a bottom than it is to a top.  For that reason I'm not going to get into another short position given the information I have.  Of course, I always reserve the right to change my mind!  Here is today's market data as reported on WSJ.com:

For today's scores, I zoomed out a bit to show you all the info that I track.  Note the 4 hour graph (3rd one down).  It is at super low levels.  Previously, the market rebounded a little when this happened.  But, my "buy" signal for the RumWave has not been triggered so I'm still waiting to make any moves.


Questions, comments, want to hire me? (just kidding... kinda)  Email me: rumwavetrading@gmail.com 

 GOOD LUCK TOMORROW!

Tuesday, September 25, 2012

QE gains given up

Glad to be right again!


Even broken watches are right twice a day!  Today my faith in the RumWave was reaffirmed at around noon.  That is the time I checked it and saw a "sell" signal.  It wasn't a strong sell, but it was a sell nonetheless.  Then in the final hours of trading the market gave up the ghost and bearish carnage was all around.  To this point, the DJIA has given up almost all of the QE3 gains as I predicted it would on previous posts.  Full disclosure, I had closed my short positions at a loss so I was not able to capitalize on this decline.  I lost my faith, lesson learned (again).  The scary thing is, this RumWave method has never been wrong as long as I listened to it and trusted it.  Here are the scores:


The 4 hr score took a nosedive today, so a rebound is likely tomorrow.  I'm not recommending to get into short positions here.  I'll wait a little bit and see how it shakes out before recommending shorts.  I'm still a little gunshy on the short side.  The DJIA daily score is still red so I think there is more room to move lower, but it might not be tomorrow or even the next day.

For those that have wondered why I trade the Dow, here's a great example.  It is often the index most resistant to moves to the downside.  So, had we been long going into this selloff we would have seen all the other indexes falling off well before the DJIA (which I've been posting since last week) thus having a "warning signal" that the decline was coming and we could have gotten out with minimal loss to our gains.  A lot of people scoff my desires to trade the Dow, but there is definitely a method to my madness.  Here's the proof, the DJIA is in green.


Questions, comments? Email me: rumwavetrading@gmail.com 

GOOD LUCK EVERYONE!

Monday, September 24, 2012

Re balancing week

Leading funds are selling, lagging funds are buying


Yesterday I watched a great video on Bloomberg online about fund re balancing.  Essentially, the video stated that funds that are heavy in stocks will be selling this week because it is the end of the quarter and they need to re balance their fund.  Here's an example.  Lets say you have a fund with $1 million under management.  In your prospectus you say that you want to hold 60% stocks, 30% bonds, and 10% cash.  Over the last quarter, stocks have outperformed bonds by a significant amount.  So, now your portfolio is heavy on the stock side.  So, you as the fund manager, need to sell some stocks to re balance your fund.  Hence the selling.

Today the RumWave chart was very very close to a "sell" signal, but it didn't quite get there.  Interestingly, the market bounced off a level of RumWave support after gaping lower at the open.  A negative day tomorrow will probably trigger it.

Tomorrow ECB news will probably dominate the headlines, as a Mario Draghi press conference is planned.  We'll see which way the market decides to interpret whatever he says.

Today's scores, coming down out of the stratosphere:


Some of you have been asking whether or not I got into oil.  The answer is, not yet.  I did some comparisons between oil and the EUR/USD and decided that with the dollar at such low levels, it is likely that the dollar will bounce at least a little and when it does it will bring oil down a little.  They are (generally) inversely related.  I'll let you know when / if I do get in.

If you have questions or comments send them my way at: rumwavetrading@gmail.com

GOOD LUCK TOMORROW!

Sunday, September 23, 2012

Will it ever stop going up?

Bearish signs.. but that may not mean anything.

There are some short term bearish signals out there that I'll highlight in this post.  However, I've been telling you that a pullback is imminent for the last two weeks and the market has gone up despite my signals, mostly due to QE infinity.. hopefully I'll finally be right.  Friday's end of day action pushed a lot of the scores for the day lower.


On the 4 hr DJIA chart above, I've highlighted bearish divergences (yellow lines) on the slow stochastic and RSI, as well as a bearish crossover (red circle) on the MACD.


On the daily chart above the slow stochastic has also crossed, although that signal is not the most reliable.  What is a sign of weakness is the candle that printed Friday.  It shows a market that tried to climb higher only to be smacked down and close lower.  When the market is at these levels this can be a indicator of the market changing directions.  Candle readers would probably tell you that we need to see a follow through day to get confirmation.


Above is the depiction of the small caps that I've been showing the last few posts.  Small caps gapped up at the open on Friday to match back up with the larger caps.  This could be interpreted as a sign of market strength.

The biggest market mover this week could be Mario Draghi giving his press conference Tuesday.  I'm sure he'll do some jawboning about how great the ECB's plan to fix the euro is, and that could move the market still higher.  I also read an interesting article over the weekend (on stocktwits) about US government officials asking the ECB to delay release of some kind of Greece report until after the election to prevent any "surprises" in the market.  It's a little bit more conspiracy theory-ish than I tend to believe but supposedly the original article was published in Reuters.. I haven't read it myself yet, but it would suggest that the market will be pushed higher (or at least not "allowed" to go lower) until after the US election.  Who knows.

GOOD LUCK THIS WEEK!

Thursday, September 20, 2012

Small caps are still declining

Beware the small caps

They may be small, but they are, none the less, powerful and make up a large part of the market.  Yes, I'm talking about small caps.  If you've been reading my last few posts you'll know how I think the small caps lead the large caps when the market starts to turn over.  Check this out:


In the last 5 trading days the Russell 2000 is down 1.35%, while the DJIA (Green) S&P (blue) and NASDAQ (red) have maintained a relatively flat level.  This setup has my attention.

Here are today's scores:


The RumWave scores are declining, but are not at the point of inflection lower.  If it does break the inflection point and it looks like the charts are loosing steam I'll probably re-enter a short trade.  For now, I'm just a spectator.  

How 'bout oil today?  Not a bad recovery.  Could it be the start of the October climb I mentioned in yesterday's post?  Not sure, but it looks like it!  I may buy some Oil ETF tomorrow while I wait for the Dow, I'll let you know if I do.

Have questions or comments about the blog?  Email me:  rumwavetrading@gmail.com

GOOD LUCK TOMORROW!


Wednesday, September 19, 2012

Small caps, oil, and bears.. OH MY!

Small caps, oil, and bears.. OH MY!

After I wrote last night's post I looked at a few more things and noticed some bullish signs in the short term charts (1-2 days.)  This morning I woke up and checked the futures first thing at 4:30 am (yes, that is when I get up for work) and the futures were positive.  At that point I decided that I need to sidestep a further impulse higher, if the market should decide to put it on.  So, this morning at 5:30am I sent an email to my close friends letting them know that I was going to sell out of my short positions at a loss.  I wasn't happy about it for a majority of the day until I came home to my family and realized that there are more important things out there than a temporary loss of cash that will be regained.

Here are today's scores:

We are still at really high levels, but coming down a bit.  We have not had the sharp selloff that would signal a top, so I think the market may try for at least one more push higher.  That may have occurred today, as the market failed to reach a new high and sold off a majority of the gains into the close.  


Above is a depiction of small caps (the Russell 2000) vs the other major averages (DJIA, S&P, NASDAQ) over the last 4 trading days.  Last night I wrote about small caps leading the large caps lower before the DJIA starts to turn over.  We can see it happening.

BLACK GOLD! (OIL)
Back in August I was bored one day and decided to build a comparison of Oil prices vs the DJIA.  I was looking for some kind of correlation.  I picked up on a couple things.  The most useful info for you right now is that since 2009, oil prices have collapsed in September.  Going long the second half of September would have met with nice gains.  The charts below show what I'm talking about nicely.


 Once again we are seeing Oil collapse in the second half of the month.  I'm not recommending it, necessarily, but I'm considering buying an oil ETF in the near future.

If you have any questions or comments about the blog, email me:  rumwavetrading@gmail.com

GOOD LUCK TOMORROW!


Tuesday, September 18, 2012

Slow grind lower

Look, I added a poll for you ---------------------------------------------------------------------------------------->
In an effort to better understand my audience and to get some interaction I've added a poll for you to participate in if you'd like.  I'm just curious what my audience's time horizon is so if you wouldn't mind choosing an option I'd appreciate it.  (No, I don't get paid for you clicking on it ;)


Today there wasn't much action in the market to speak of.  What I did find interesting was that the DJIA closed up 11 points and the S&P closed down 1.87 points.  My casual observation of these indices has led me to the conclusion that they should be approximately a multiple of 10 of each other.  For example, if the S&P is down 5, I would expect the DJIA to be down 50, plus or minus a few.  Today's closing values would indicate a notional 29 point difference (in DJIA terms) between the two.  That qualifies as "weird" in my book, but also makes sense in relation to one of the RumWave principles.

The reason I trade the DJIA and not the S&P is because it has been my observation that DJIA stocks are the last to move to the downside.  Often, the small caps (Russell 2000) and S&P start to decline before the Dow.  As a Dow trader, this gives me a warning signal to get out before the Dow starts to turn.  For additional situational awareness on today's action, the Russell 2000 was down .23% supporting the theory.  It will be confirmed if we start to see a larger decline in the mega-cap stocks (aka blue chips).

Here are today's scores:


The overall daily score moved out of the 1000's, we'll see if the market wants to continue lower tomorrow.

If you have questions, concerns, or thoughts about today's post email me: rumwavetrading@gmail.com

GOOD LUCK TOMORROW!

Monday, September 17, 2012

Retracement started today

Giving back some gains

Today the market started to give back some of the gains of last week.  The daily scores below are still high, but the overall score gave back about 100 which is a step in the right direction.  We should get back some of the losses that the short position caused.


Above is a Fibonacci Retracement of the latest impulse.  I think a pullback to the 50% or 61.8% retracement lines are likely.  It is important to note that this may or may not be the RumWave buy point.. we'll just have to wait and see if the two happen to line up.

Have questions, concerns, or just general comments about the blog?  Email me: rumwavetrading@gmail.com 

GOOD LUCK TOMORROW!

Saturday, September 15, 2012

Don't be an economist, be a trader

Whether you agree with it or not, QE3 is here

I've been reading and hearing a lot of commentators talk about whether or not QE3 was the right thing to do or if it will work for economy stimulation.  I think that discussion is irrelevant to market traders.  The policy is here, now it is our job to deal with it and make money off it.  The Fed has pretty much thrown their full guarantee behind the stock market.. at least until the fiscal cliff.  That being said, I'm still watiting for the inevitable pullback before going long, and I still have my short ETF.. which is painful at this point.  Overall, not even QE3 rallies move in straight lines, and I'll show that after the scores.

Over 1100 on the daily score above!  New record hi.

Below are charts of the DJIA from the day of their respective Easing / Twisting announcement.  The initial pop is met with a swift and dramatic decline before the market takes off.  That decline is what I'm waiting for.

DJIA After QE1 announcement

DJIA after QE2 announcement

DJIA after Operation Twist announcement


GOOD LUCK NEXT WEEK!

SUNDAY AFTERNOON UPDATE:

Monday's news that will be blamed for market reversal?:


Thursday, September 13, 2012

QE3 is here!

Great news for equities


Here is the translation from Fed speak to Fighter Pilot speak:  buy whatever stocks or commodities you want, we are here to make sure the stock market goes higher... forever.

I'll be the first to admit that I was wrong about the QE3 announcement.  I didn't think it would happen, but it did and I got hammered, as did my friends that trade with me.  I'm not happy about that for obvious reasons, but I didn't sell out of my short position today.  The reason is the calculated score chart below:


We were already in overbought territory before the announcement, and now we are in nose-bleed territory.  The overall daily score has topped out around 900 on previous waves.  Today's rally drove the score to 1028!  This will be a great test of this measurement tool.  If the scoring system turns out to be correct, it will have proven itself against dramatic Fed action.  I'm looking forward to observing how it turns out!

Here are a couple thoughts going through my cranium for most of the day today:
1) Don't fight the fed
2) Never buy at a 52 week high (there were a lot of those today all over the market)
3) Big movements away from moving averages lead to big moves back toward them

I plan to operate within these guidelines for the rest of the year.  I suspect the market will exhaust the Fed sugar high shortly.  That is when I'll get out of my short positions..  I may still take a loss, but it won't be as big as if I jump ship now.  

GOOD LUCK TOMORROW!


Wednesday, September 12, 2012

The main event

To Ease or not to Ease, that is the question

Tomorrow is the big enchilada.  Here are the scores going into the announcement of whether or not the Fed will continue easing measures:

The new-ish total score has rebounded to well overbought levels.  Previous tops have peaked out around 900.  This one is not quite there, however, one of my indicators that goes into the calculation of the RumWave score fell off a cliff today, reducing the overall score.


Above is the scoring system zoomed way out.  The Daily score (2nd down) and 4 hr score (3rd down) are the highest they have been since I started this tracking system in June.


And just for fun, the chart above shows some bearish divergences on the DJIA 1 hr chart.  

Almost every news analyst is 100% convinced that the Fed will announce some kind for easing tomorrow.  I'm not so convinced, but hey, I'm just a fighter pilot with a knack for predicting market moves so I'll defer to the 1000 lb brains and their high priced degrees on that one.  The stimulus could range from full blown bond buying (aka printing money) or a simple announcement of their intent to keep interest rates low until the year 20XX.  I suspect the market may find a way to be disappointed by the announcement.

GOOD LUCK EVERYONE!