
Thursday, July 31, 2014
Market Update - No Man's Land
Wednesday, July 30, 2014
Market Dashboard - positive

Tuesday, July 29, 2014
Market Dashboard still positive


Saturday, July 26, 2014
Market Dashboard - trend still points higher


The S&P 500 may not be completely done declining, but the 50% retracement coincides with a price volume node so we may see some support at the $197.34 price level.

Thursday, July 24, 2014
Market Dashboard - cause for protective stops

Today's post is specifically directed toward those that trade with me. I am seeing some weakness in the LDI. Although the indicator is still bullish, it is showing some signs of slowing momentum in the overall market. That said, I STRONGLY recommend protective stops.
TNA Protective Stop that I'm using is $69. (Below)

UDOW protective stop I am using is $122.

Tuesday, July 22, 2014
Market Dashboard - Uptrend

Monday, July 21, 2014
Market Dashboard - Bullish

The market dashboard is still favoring a bullish move in the near future. I think we will likely see it materialize over the next couple trading sessions. The IWM has likely formed a bottom and was giving back a little ground today after a big run on Friday.

Saturday, July 19, 2014
Market Dashboard - Indicators Turned Positive

RUM Wave indicators have signaled a bullish wave entry point. Earlier in the week the Super Bull indicator was triggered, however it was a little premature. Now we are seeing a reversal of Primary Indicator 2 after it touched the green zone. Primary indicator one is in the green zone. On Friday morning, the Very Short Term Indicator was also in the green. Finally, the Leading Directional Indicator has turned positive. All of these events suggest a bullish impulse began on Friday and will continue for the short to medium term.
Below, the IWM chart is quite busy but price action has rebounded off the 61.8% Fibonacci retracement line, and at a node of increased price volume (indicated by the turquoise graph.) This chart looks like the most likely candidate for a substantial rally.

The SPY chart below shows some sideways consolidation. Traditional analysis would suggest that it looks ready for a correction. However, RUM Wave analysis suggests that it is about to start a small bullish impulse.

Friday, July 18, 2014
Market Dashboard - Slightly Early on Entry Point Call

I was slightly early on the entry point call, however the turn is still forming.
Wednesday, July 16, 2014
Market Dashboard - Entry Point

Tuesday, July 15, 2014
Market Dashboard - Super Bull indicator in the green


Monday, July 14, 2014
Market Dashboard - early reversal

Today's reversal was somewhat expected, however it was a little premature to call a RUM Wave entry point. It may have been the bottom, but I'm not yet convinced the bears have given up.


Saturday, July 12, 2014
Market Dashboard - Holding fast

In the charts below we can see that the small caps are in a pretty solid downtrend while the SPY is at a price level with lots of previous trading volume (indicated by the blue graph on the right.) I would consider it a potential pivot point - either higher or lower. I think we may see a little bounce early in the week, hopefully followed by another larger downleg to create an oversold condition that will signal a solid entry point.


Thursday, July 10, 2014
Market Dashboard - Not entry yet
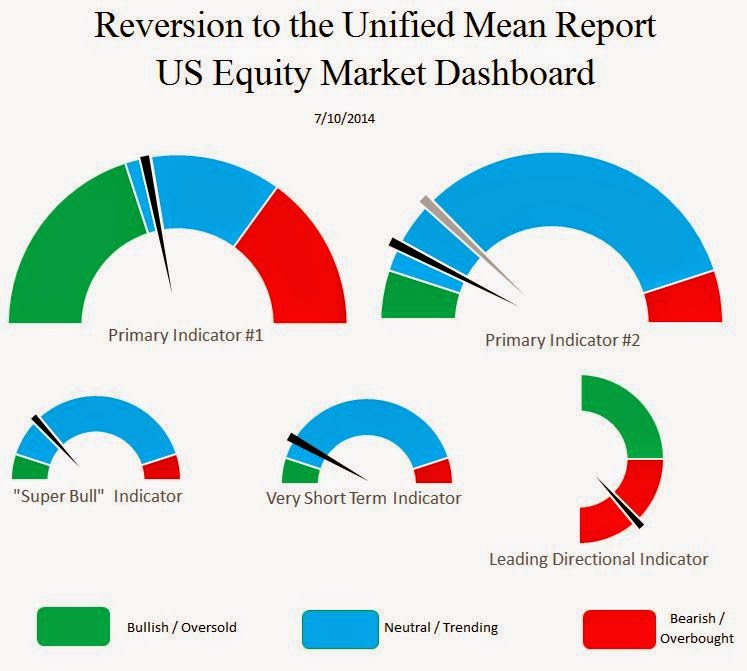
Even though today was a significant move lower, I do not see this as an entry point. There is still more downside needed before the RUM Wave indicators move into buying territory. Today we again saw the SPY cut some losses, but the IWM (Russell 2000) was down by a little more than 1%. The timeline for market entry looks to be targeting sometime next week.


Wednesday, July 9, 2014
Market Dashboard - Closer to entry point

The needles on the dashboard are all moving toward the green areas, but they are not yet signaling a solid entry point. Interestingly, in the charts below you will see that the SPY showed a little strength, but the IWM (small caps) showed continued weakness. The math behind RUM Wave heavily considers small cap movements, usually as foreshadowing events to the larger cap indexes.


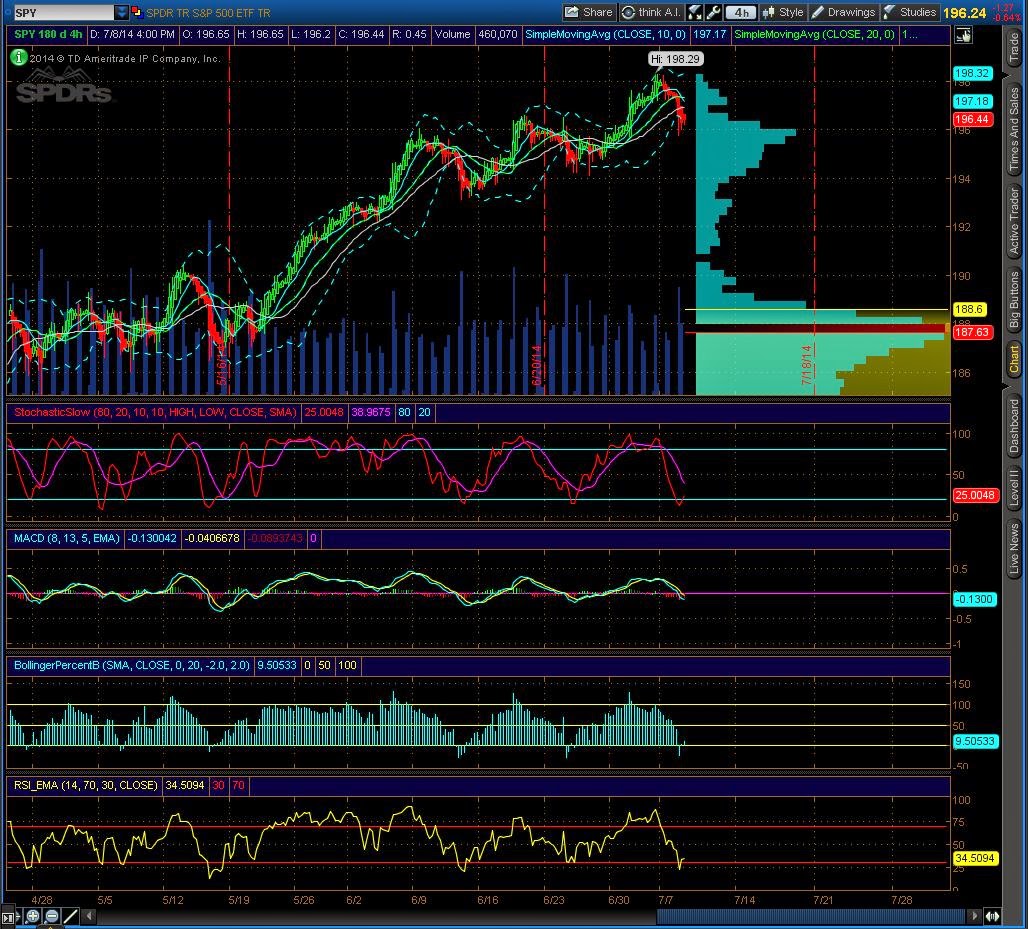
Tuesday, July 8, 2014
Market Dashboard - Still not an entry point

The SPY and IWM oscillators (below) suggest that a short bounce is in order, but RUM Wave analysis does not suggest that this is a good entry point for a medium term investment.

Sunday, July 6, 2014

Wednesday, July 2, 2014
Market Update - Unchanged

Tuesday, July 1, 2014
Market Dashboard - Unexpected Spike

Today's market spike was not expected. The LDI is still bearish (barely.) My analysis does not suggest that this is a good entry point.

Subscribe to:
Comments (Atom)

