Ready to go
On Friday the market looked like it put in the bottom from a technical perspective. The SPX bounced perfectly off the 61.8% retracement level, while the DJIA moved a little below its 61.8% retracement before rebounding. More importantly, the RumWave chart is perfectly set up for a very nice bullish move. I think it started Friday and will continue for the next 10-20 business days. I'm not sure what the catalyst will be, or more accurately, what the press will attribute the move to. I'm sure they'll find something to build a headline. At this point I am fully invested in my intended bullish positions.
Here are the daily scores. I made an adjustment to their formulas to get rid of the skewed results I've been having. I think this revised formula will have more constant results.
In the chart above, the green scores for Friday more accurately depict where the DJIA is from a technical perspective. Right now, we are quite oversold as you would imagine.

The chart above is the SPX. I usually follow the DJIA, but the SPX is the "trader index" so it is worth noting that it is bouncing off the perfect retracement level, the MACD is very low and potentially forming a bottom, and the TTM Squeeze indicator is showing a little sign of a change in trend (red bars turning yellow).
Above is the result of plugging the data from the AAPL chart into my scoring system. In theory, it should work for any stock, although I don't have the historical data to back it up. The score of "33" is pretty low and indicates that the stock is well oversold on a weekly chart view.
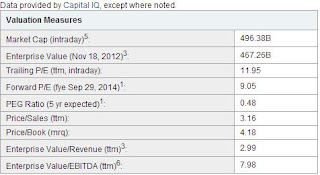
Lastly, the screen capture above is from Yahoo. This is my favorite place to evaluate the fundamental value of a company. One of my favorite measurements is the Forward P/E. At 9.05, AAPL is cheap, especially if you are like me and believe that Apple is one of the best companies on the planet.
So, if I believed in buying individual stocks, I'd be buying AAPL as an investment.
TSP Gameplan: C and/or S fund.
GOOD LUCK NEXT WEEK!
Questions, comments? Email me: rumwavetrading@gmail.com


No comments:
Post a Comment