Monday, April 1, 2013

Bears caught honeybadger napping

Interesting day

To start off the quarter, the market seemed to show some signs of fear.  Maybe the big money decided to take a little profit here to protect what has been an incredibly profitable first quarter for bulls.  What really got my attention was that the Russell 2000 small cap index (RUT) was down 1.3% while the DJIA finished flat.  In all my studies that led to the development of the RumWave, this was what I noticed when the market had reached a top.

I'm sure that we'll pop tomorrow, but I still think there's danger on the horizon, and it may be closer than a lot of people think.

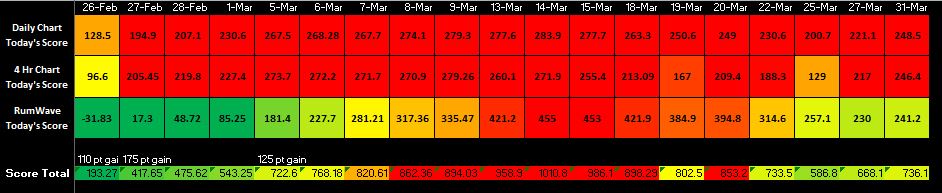
Scores:


"Score Total" June '12 to today:


GOOD LUCK TOMORROW!

Sunday, March 31, 2013

Q1 is done

Disappointing first quarter for the RumWave, but there is plenty of time left


Well, friends, that wraps up the first quarter of 2013.  Amazing how fast it has gone!  I'm a little disappointed that there were exactly zero buy signals produced by my trading model, but that's just the way it went.  I'm not overly concerned because I'm still confident that follow on signals will propel us beyond the DJIA benchmark I have chosen.  The good news is that we didn't loose anything either.

All that said, I'm still a bit nervous about this market.  Fundamentally, I think things are humming along nicely and the Fed has pretty much focused all of their efforts at raising equity prices and boosting the housing recovery.  It appears to be working.  However, even the strongest markets have to pull back from time to time.  Today's post is dedicated to predicting such an event.

First, my calculated scores:

"Score Total" since June '12; hovering around mid range giving plausibility to bullishness or bearishness:

Now for the weekly charts:
DJIA:

What I notice about the above chart is that the RSI is showing a market that is really overbought.  Such conditions leave a lot of room for the market to fall if the right catalyst occurs.  I also drew a trendline on trading volume.  It has been steadily declining, which is a sign of a tired market.

Here is another look at the DJIA weekly chart, this time from barchart.com:
I just threw this in because it is another way of looking at the same info, but it is easy to see just how far above the 20 day moving average we are (the red line on the upper graph).  Markets will always revert back toward that mean, often violently and with little warning.

S&P 500:

On the S&P chart above, I increased the size of the Slow Stochastic and MACD.  What caught my eye was the Slow Stochastic %D line.  It has rolled over, taking a negative slope.  I went back and put some vertical hash marks on similar instances in the past.  I matched up those hash marks with the MACD and the overall upper chart.  The results show that this condition occurs before multi-week declines.

Pictures are worth a thousand words, which is why I like technical analysis so much.  All of the above data lead me to the conclusion that a significant event is not far away.  My investing ship is in the safety of the harbor for now, and I'll be happy to keep it there as long as necessary to protect it.

GOOD LUCK NEXT WEEK!

Wednesday, March 27, 2013

All eyez on me

First ever televised bank runs.. or not

Today I was fortunate enough to listen to a lot of CNBC and Bloomberg in my truck.  The general trend seemed to be concern about Cyprus bank openings tomorrow and, to a greater extent, the inability of the Italian gov't to create a majority (or whatever it is that they do.)  The honeybadger market is in a bit of a rut, but it is a day trader's dream.  Buy at low oscillator levels, sell at high ones.  It's worked for the last couple weeks.

Daily scores:

GOOD LUCK TOMORROW!

Tuesday, March 26, 2013

Quick post

No news is good news

This morning my Twitter feed had no references to Europe or Cyprus for the first time in ages.  The market rebounded this morning as I suspected it might.  Tomorrow.. I don't really know.  It will be good to see if the bulls can continue their push to new S&P highs.

GOOD LUCK TOMORROW!

Monday, March 25, 2013

Uh, what I meant to say was...

Foot-in-Mouth disease


I swear, those European officials have such a hilarious tenancy to say dumb stuff when the cameras turn on.  Today's example was the dude that said, and I'm paraphrasing, that Cyprus could be a model for future bailouts throughout Europe.  Way to freak out the markets, bro.  Somebody should see if that guy shorted the market an hour before his press conference.

I'm sure there will be a substantial amount of backpedaling in the early hours of tomorrow's European trading.  Based on that, and the DJIA oscillators I like to look at, I would fully expect a gap up tomorrow again.

Today's scores:


Score totals June '12 to today:

GOOD LUCK TOMORROW!

Saturday, March 23, 2013

Technical signs

Honeybadger poison for sale...

The honeybadger market, as I've been calling it, flopped around to end the week ever-so-slightly down.  I guess the big money scoffed the Cyprus issues and decided that the Stimulus will be enough to get us through whatever the "Cyprus-Crisis" can throw at us.  I can see their point.  After all, where else in the world would you want your money to be right now?  The US stock market seems to be a nice incubator for hard earned capital.

That said, we are wicked overbought.  If only there was something to start the ball rolling down hill.... more on that to follow.  First, my calculated scores:


"Score Total" June '12 to today:


The weekly chart of the DJIA is below.  We broke through the yellow trend line nicely when it was a level of resistance.  Now, it should be some kind of support when the market does decide to correct.  This week's Heikin Ashi candle was not more bullish than last week's.  This is a sign of weakness.  What bugs me is the RSI.  It is out-of-this-world high.  If only there was a reason to roll the market over...


Oh, look.  Here it is.


The head and shoulders pattern (above) on the DJIA (5 minute chart) could give market technicians just enough reason to start selling.  My experience has been that these thing turn into "self fulfilling prophecies" once the computers that look for patterns and humans that look for patterns (and there are a lot of them) think they see a recognizable formation.

If it does take hold, the target is in the vicinity of 14,250.  If not, the Honeybadger didn't eat the poison.

GOOD LUCK NEXT WEEK!


Thursday, March 21, 2013

Honeybadger naptime

Sorry for the lack of pictures tonight, but I'm short on time. Here's the deal... the RumWave chart is showing a pivotal point. It is against some support here, but if it breaks through there is a lot of room to run down. Despite the general apathy toward the crisis in Cyprus, Europe posted some pretty weak numbers overnight that keep it in recession-land. I'm not real optimistic about a region in a recession that has a member of its currency group about to "restructure" its banks on the back of an attempted blackmail of Russian bazillionaires. Call me crazy.