Monday, September 10, 2012

Going short

Postured for a downturn


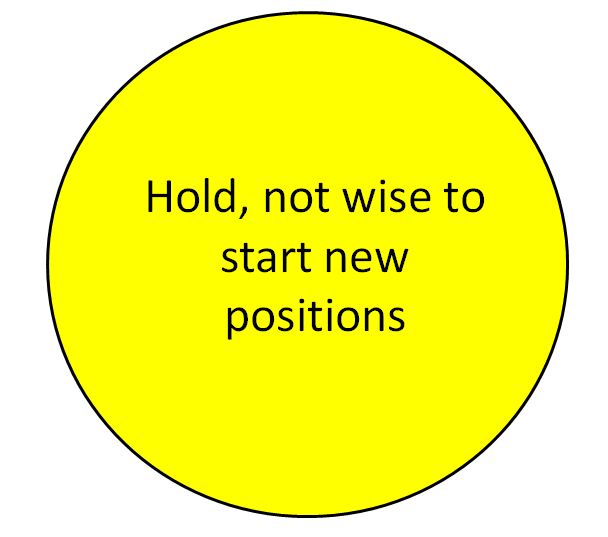
This morning I sent an email to my close friends recommending they prepare for a small downturn in the market.  At that point I moved into my 3x inverse DJIA ETF.  


The scores and score total oscillator are showing a turn in direction.  I may be a day or two early on my position, but I think there will be some kind of big whooosh down in the near future.  If it does happen, I'll be in a position to profit from it.  

GOOD LUCK TOMORROW!

Saturday, September 8, 2012

Ready to go short

History favors a small sell off

Today I'm introducing a new oscillator on the blog.  I decided to create an overall score each day based on the Daily, 4hr, and RumWave scores.  By simply adding them together and plotting them on the graph, we get a little better feel for market bottoms and tops.  


From now on you will see the above chart and graph.  The new "Score Total" section is shown with the normal red-yellow-green system and it is also graphically shown for reference.  Currently the score total is in the red.  It is a little hard to read, but the score is 841.  Previous peaks since I started keeping scores were in the vicinity of 900 (+-20).


DJIA 4hr Chart

 There are two things I'd like to point out on the 4 hr chart above.  First, the candlesticks are taking on the tell-tale "twisted ribbon" appearance indicating that this impulse's momentum is drying up.  Second, the CCI has started a turn down from a very high level.  In the past, this has occurred 2-5 candlesticks before a major change in trend.

DJIA Daily Chart

 On the daily chart above the CCI is reaching a peak level.  If it starts to turn down, we would expect the market to change direction a few candlesticks later.  That scenario would make sense based on the slow stochastic.  The red line has not crossed the aqua blue horizontal line yet.  So, it is likely that we'll have another day or two of up / sideways, then reverse course.  I expect to look for a shorting opportunity early in the week.

ENJOY YOUR WEEKEND!  GO AIR FORCE, BEAT MICHIGAN!

Thursday, September 6, 2012

Don't be a chaser

Rip your face off rally

I would call today's action a "rip your face off" rally.  Impressive reaction to the ECB's announcement of a bond buying program to bail out ailing European countries.  Market demand was coiled up like a spring according to the daily scores for the last few days.  Be very cautious about buying into this pop.  A quick review of the pictures below will quickly illustrate why I'm not a buyer here.


On the daily scores, today's action was a rocketship, propelling the 4hr and daily scores into red territory.  Note the chart of 4 hour scores above.  The timeframe is 1 Jun - today.  You'll note how high the the 4 hour score looks relative to previous peaks.  This alone is enough for me to say, congratulations to those that made a killing today, but I'm not pitching into this fight.


The ascending slope of today's candles, %B, and the CCI (a new addition to my charts) is astounding on the 4 hr chart above.  


The daily chart is also showing the spectacular move.  What I note is that the RSI is reaching peak-ish levels.  Maybe we see a couple more days of market advance, but then it should come back to reality.  I tend to believe that the slope on the way up is, more or less, the slope on the way down.  That would lead me to believe that a snapback is likely and those short term traders that are chasing this news event will get hurt.

GOOD LUCK TOMORROW!

Wednesday, September 5, 2012

ECB decision tomorrow

Another big day

ECB meeting / decision tomorrow.  Here's something to think about.  If we get word of "stimulus" in terms of bond buying that should have a deflating effect on the Euro currency, like it did with the US dollar.  This would result in a stronger US dollar.  Problem is, a weaker US dollar has been a big part of the market rally for the last few years, so a strong dollar as a result of Euro weakness as a result of bond buying stimulus would probably not really be a good thing.

If we do get a pop from the ECB meeting, I think there may be some rejoicing over their movement toward fixing their problems, but the deflation of the Euro currency will be a longer term negative for the US market.

Today's scores, not much change:


GOOD LUCK TOMORROW!

Tuesday, September 4, 2012

Blame it on the stimulus

If everyone stimulates, no one stimulates

I don't know about you, but I'm so tired of hearing the market is moving on "hope of [insert country name here] stimulus."  The whole thing is ridiculous, and is a terrible "reason" for the market moving.  I personally think that news commentators that cite this as the reason for a market move are really saying "I have no clue what is going on here and I'm too lazy to do some real research, but this sounds like a good headline."  I'm also tired of hearing about friggin' facebook.  We get it, people that thought they were going to become instant bazallionaires got it stuck where the sun don't shine.  End of story.  If you happen to be a news commentator and are reading this, please stop this ridiculous story re circulation and find something new to talk about.  Rant complete.

Today's scores below:

The RumWave score actually climbed a bit today, thanks to the end of day surge.  Interesting stuff going on here.  For now, the buy signal looks to be about a week away.

GOOD LUCK TOMORROW!

Monday, September 3, 2012

Euro/Dollar bearish divergence

Eye on the Euro

This morning I decided to take a peek at the Euro/USD to see how it looked.  I noticed a bearish divergence between the tops of the candlesticks and the tops of the RSI.  Then, I put the numbers for that chart into my scoring system.  Below are the results.


The Euro has had a nice run though August.  Lots of European headlines this week, particularly on Thursday with the ECB policy announcement.  The chart and the score look like the Euro is ready to give up the ghost on any negative news.  Just something to keep an eye on here in the US markets, as we tend to be somewhat correlated to the Euro/USD.

GOOD LUCK TOMORROW!

Saturday, September 1, 2012

Not high confidence in this little pop

Fed jump likely short lived

Thank goodness that Jackson Hole stuff is done!  From my daily scores I anticipated that any little hint at further easing would cause the market to jump.  It was primed to do so, and it did.  

For those that may be new to the blog, the chart above is my daily scoring system, I developed it to take some of the emotion out of reading charts.  I input some numbers into an excel formula I built and it returns these scores which are color coded based on previous wave tops and bottoms.  Green indicates a bottom is near, red indicates a top is near.  The time horizon of the expected move can be determined by looking at which chart the numbers are referring to.  Scores in the "Daily Chart" category tend to show where we will go over the next week or so.  Scores in the "4 hr Chart" category do a nice job of predicting where we will go over the next couple days.  The "RumWave Score" is the scoring system (excel formula) applied to my proprietary "Reversion to the Unified Mean" market theory, which is a whole other analysis tool.  Referring to the chart above, we can see that the Daily score and the 4 hr score were both green yesterday, indicating that the market was ready to move upward.  Note, however, that the RumWave score was still yellow.  I think of the RumWave as a "lie-detector" for these moves.  Right now, it is telling me that this "Fed jump" is likely to be short lived and that now is not a time to start a new bullish position.


DJIA 4hr Chart

Here is the 4 hr chart that I like to look at.  For those that may not be as familiar, each candle represents 4 hours of time.  Nothing too remarkable here, except that the Slow Stochastic (one of my favorite oscillators) is at low levels.  When the no-kidding bottom does get here, the move up will likely be swift.


DJIA Daily Chart


Above is the Daily chart for the DJIA.  Each candle (in the top section) represents 1 day of time.  What is striking to me is that yesterday's market climb did not turn the candle green.  For those that are unfamiliar, I like to use the Heikin Ashi candles.  I find them easier to interpret and can give some interesting info that standard candles cannot.  I do, however, always switch back over to standard candles, just to see if there is some easily recognizable candlestick pattern (Hammers, Doji, Tweezers  etc) as those can also be good information.


DJIA Weekly Chart

Finally, here is a Weekly chart of the DJIA.  Last weekend I mentioned this chart and that I thought we were due for a multi-week decline.  This week caused the red line of the slow stochastic to turn back down a little.  I think next week will likely be another week that is sideways to slightly down based on what I see on this chart.  This correlates with historical patterns for the first two weeks of September, which tend to be negative.  In fact, I already saw CNBC calling it the "September Swoon".  

So, the bottom line is I'm standing by to buy in the near future.


Just for fun, above is a snapshot of RumWave reader locations from Google Analytics for the month of August.  It is amazing to me how this has spread.  There is still plenty of room to grow, so if you enjoy this blog feel free to send one of your market-savvy friends a link! 

GOOD LUCK NEXT WEEK!  U.S. readers enjoy your long weekend, and the start of College Football Season!