Thursday, August 9, 2012

Took profits today

Pigs get fat, hogs get slaughtered

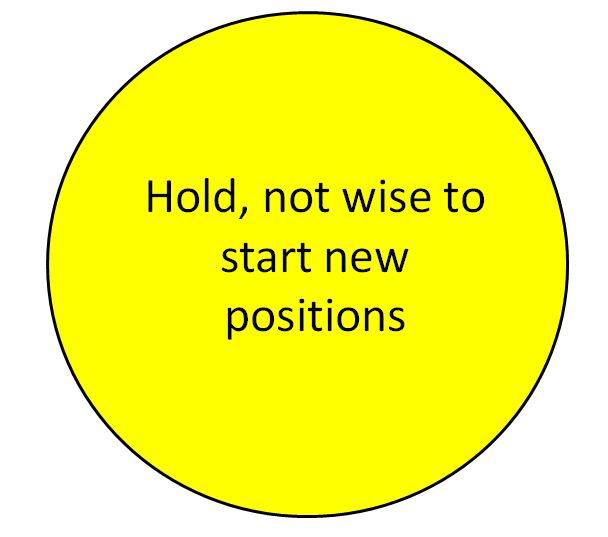
Today I decided to close my long positions.  The RumWave isn't showing a definite "sell" signal, but there is not a lot of up room and plenty of down room to run.  So, I took my 7.5% profit to the bank.  Not to shabby for two weeks worth of minimal effort!


One of the big deciding factors for me today was the calculated scores (above).  There is just SO much red that I can't keep looking at it without any action.  The scores are not the highest I've ever seen, but they are high enough for me.  If the market does decide to make another move higher from here it will probably result in a more severe decline on the backside.  We'll see what happens, but my investing ship is safe in the harbor just in case that "unexpected" storm shows up.  There hasn't been much negative news (or positive news for that matter) from Europe lately.. 


The 4 hr chart (above) is showing a sideways consolidation move so far.  We'll see if it breaks to the downside in the next couple days I think.  


The daily chart (above) is displaying what I call the "twisted ribbon" appearance on the candlesticks.  Coupled with the Slow Stochastic running at high levels, I have to think that a break to the downside is very likely.

For what its worth, the two best Elliot Wave counters I follow are calling for a continued move higher.  A lot of times they are right, but I find that the RumWave usually lead-turns their predictions by a few days.  Especially when their wave counts "fail".

All that being said, I'm on the sideline for the next little bit. 

GOOD LUCK TOMORROW!

Wednesday, August 8, 2012

Still Holding

RumWave says HOLD

Over the last couple days I've had several people ask me if I am still holding my long positions.  The answer is yes.  However, I could take a 6+% profit here and walk away.  That's not what the RumWave's emotionless recommendation is telling me to do.  It says to continue holding.  So I still am looking for a fairly strong down-move before continuing higher for one more impulse.  


The daily scores (above) are showing a lot of red.  Today didn't help those 4 hr and daily scores cool off any.  The pending decline is inevitable, and the longer the market waits the more violent it will probably be.  Regardless, the RumWave chart (that I don't post on this blog) has not met its sell criteria.  So, I will keep holding.  I think there is one more leg up to go before a sizeable decline.


The momentum is drying up on the candlesticks and the slow stochastic is still really high.  Not strong bullish signs.  It is worth noting that the market doesn't always behave in a totally rational manner, so we could go a bit higher.


The daily chart is still showing overbought indications.  I still expect a pullback to cool off those oscillators that are at very high levels.

BEST OF LUCK TOMORROW!

Tuesday, August 7, 2012

Becoming more overbought

Due for a pause in the action


Yesterday I wrote that I expected a pullback today.  That did not happen and the market decided to push a bit higher.  While that may seem like a good thing, it just pushed us further into overbought territory.  The RumWave is still suggesting there is more upside, but I think we will see a little snap back before moving to new highs.

The daily scores above show some solid pushes into orange-red territory.  The internal components that make up the 4 hr and Daily scores also displayed several "red" numbers.  


On the 4 hr chart above I have highlighted a bearish divergence between the higher highs on the candlesticks and the lower highs on the RSI (yellow lines).  This is a signal that a pullback is probably just around the corner.


 The slow stochastic on the daily chart above is at 91.8.  This is a high number.  It usually doesn't go much higher before turning down.

Overall, I am still holding my long positions.  I expect a pullback, but the RumWave is not producing a sell signal so I will wait until then to take profits.

GOOD LUCK TOMORROW!

Monday, August 6, 2012

Pause or pullback likely

Pause or pullback is probable, but nothing to be worried about

The calculated scores for today indicate a pullback is likely tomorrow.  The 4 hr chart score is very high, however the RumWave shows a positive trend through at least mid August.  I am continuing to Hold my 
bullish positions.


The 4 hr chart (above) slow stochastic is at overbought levels.  It will probably move back down a bit.  Of note, the RSI is displaying a bit of a bearish divergence.


 The Daily chart (above) also shows us to be at high slow stochastic levels.  I think a little give-back may be in order.  We may have seen the start of it in the last 30 minutes of trading today when the market gave up steam drooping from +70ish to +20ish.

GOOD LUCK TOMORROW!

Saturday, August 4, 2012

Continuing Higher

Strong bullish showing Friday!

Friday's action was great for those that were long (make money if the market goes up).  The RumWave has been suggesting a bullish run and continues to favor further moves to the upside throughout the first half of August.  I will continue to hold my 3x DJIA ETF until the RumWave produces a sell signal.


 There wasn't as much cooling of the calculated scores (above) on the 4 hr / Daily chart as I would have liked.  Frankly I was a little surprised that the market chose Friday to run up.  But that is why I rely on the RumWave to tell me which way the market will probably go over a longer period (10-20 days).  The predictability of that time period in my backtesting (as far back as 2005) is far, far more stable than trying to call daily market direction.

DJIA 4 hr Chart
 The 4 hr chart (above) is still encouraging from a bullish standpoint.  The %B and Slow Stochastic are not at extreme levels, which I interpret as bullish.

DJIA Daily Chart
The Daily chart (above) also has some high oscillator readings, but they are not extreme yet.  On a strong bullish run, it is not unusual to see the oscillators stay at relatively high levels for the entirety of the wave.

GOOD LUCK NEXT WEEK!

Thursday, August 2, 2012

Bittersweet

Just like we called it


For the last several days I've been calling this pullback based on the calculated scores below.  This system is turning out to be very accurate.  Overall, the RumWave still calls for more upside through the first half of August.  Tonight I have two "lights" displayed (above).  RumWavers that already bought into this rally should hold their positions.  Those that missed the buying opportunity are presented with another opportunity here.  


 The calculated scores (one of my two proprietary market analysis tools) show some cooling today in the 4 hr chart score.  I think we could see another day of consolidation (read decline) tomorrow before the rally resumes in a substantial way.


DJIA 4hr Chart (with Fib Retracement)
For tonight's 4 hr chart (above) I drew a Fibonacci Retracement of this last minor wave.  Today we bounced off the 61.8% level.  I interpret this as a bullish sign.  Also note that the RSI bounced off it's lower levels.  It could jump back down again, but overall it is pretty low.  The Slow Stochastic is also showing signs that this decline could end relatively soon.


DJIA Daily Chart
 The Daily chart (above) is not quite as encouraging, and suggests there is still a little more donwside possibility.  This correlates with the daily scores to suggest there is probably one more down day.  Then, we will resume the uptrend, probably Monday.  Maybe some good words out of Europe over the weekend??

GOOD LUCK TOMORROW!


Wednesday, August 1, 2012

Down with ECB? Yeah you know me.

Markets await ECB news

As expected the US Fed did not deliver additional easing measures.  Tomorrow we get news from Mario Draghi and the ECB about what measures are going to be taken.  The market is still poised for a little snap down, but my gut feeling is that they will come through with a strong set of countermeasures to their current issues.  We will know soon enough!


 The proprietary daily scores are still showing a solid red score for the 4 hr chart.  There were not any "red" returns on the internal numbers again today, so that is a good sign that the market could go higher with positive ECB news.

DJIA 4hr Chart

The 4 hr chart slow stochastic is showing a crossing point on the red and purple lines.  What I do like is that the red line has cooled off a bit.  It could move back up from here if we had good headlines.

DJIA Daily Chart

 The daily chart is still showing some room to decline on the slow stochastic and the RSI.  It could go either way, but the RumWave is still showing some very bullish projections about the next 10 or so days.

GOOD LUCK TOMORROW!