Saturday, July 14, 2012
Friday was not a game changer
This is just a quick post to let everyone know that the 200 point rally Friday did not change the RumWave outlook. Keeping the faith is hard on days like this, but I have full faith in my method. I'll post scores and charts later when I have an bit of extra time.

Thursday, July 12, 2012
About 2/3 thru decline
RumWave indicates 2/3 thru decline
Today we saw an impressive rally from the gap down at the open back to positive territory then a decline at the very end of the day. This action resulted in a continued decline in daily scores. Ultimately, the RumWave (my proprietary indicator) shows that we still have some room to decline before the trend direction changes.

The daily scores (that I calculate each night) are showing a very green 4 hr chart score. However, the RumWave score and Daily Chart score are still in the yellow range. This indicates the bulls should start to fight back a bit in the near future.
 |
| Not a good time to start new bullish 10-15 day positions, further decline likely. |

The 4 hr chart matches with the color coded daily score. The candlesticks show an easing of downward momentum while the Slow Stochastic and %B are at quite low levels. The RSI is also low and the Rate Of Change indicator shows a slowing in the ferocity of the decline. The wave count on this decline lends itself to today being the "4" wave. Next would be another leg down completing a "5" wave pattern. This correlates with the RumWave's prediction that we are 2/3 through the decline.

The daily candlesticks show no sign of letting up, Slow Stochastic has room to decline, and a bearish divergence is still visible between the candlesticks and RSI, indicating a likely continuation of this downward trend.
As always, BEST OF LUCK TO YOUR TRADING TOMORROW!
Wednesday, July 11, 2012
Bounce likely, forecast negative
Scores indicate a bounce is probable, but further decline ahead
The daily score on the 4 hour chart is at a low level, indicating a relief bounce is in order. The market rallied at the end of the day today and it seems reasonable it would continue tomorrow for at least half of the day. However, a jobs report comes out at 0830 EST and those are always unpredictable. With no sign of QE from the Fed Minutes today I don't think a "bad" number would entice a rally as it had before on hopes of more QE. Regardless, the RumWave is still indicating the path of least resistance is downward for the next 10 - 15 days. I have positioned the UltraWave to take advantage of further declines with a 3x inverse DJIA ETF.
 |
| Not a good time to start medium term (10-15 day) bullish positions. |
 |
| Calculated Daily Scores |
 |
| DJIA 4 hr Chart |
The candlesticks on the 4 hr chart don't show any signs of letting up despite the overall daily calculated score. However, %B is low and the red line on the slow stochastic is also at oversold levels. It is worth noting that the purple line on the slow stochastic has room to decline before reaching oversold levels.
 |
| DJIA Daily Chart |
If you enjoy the material in this blog, please help me keep it open to everyone by visiting a sponsor link on the page. GOOD LUCK IN YOUR TRADING TOMORROW!
Tuesday, July 10, 2012
Sell Signal Today
"Not Up" trend confirmed today, probably for the next month

Today the RumWave triggered a SELL signal. I had already sold out of my short positions earlier last week based on RumWave indications, but today was the pure RumWave sell signal. I will re-enter my short position with a 3x inverse DJIA ETF when we get a little bounce. Right now the market is at a fairly oversold level, so I'd expect a little jump in the next day or two. So long as that jump doesn't go back over the sell signal criteria, I'll establish short positions for the UltraWave.

The scores are showing a greenish tint on the 4 hour, but the RumWave is still high. This supports a short term bounce by the end of the week I suspect.

The 4 hr chart printed a bearish candle this afternoon with a strong downward push. The %B is getting low, but at 24%, it still has room to decline. The slow stochastic is also showing room to decline, but the red line is pretty low, so a small rebound may be in order.

The daily candlesticks continue with a revitalized downward momentum. The bearish cross of the slow stochastic lines continue to support an extended decline.
Nothing is for certain in this business, but the RumWave sell signals are usually very accurate. They have given head fakes before, but overall I trust them and will base my trades accordingly.
GOOD LUCK!
Monday, July 9, 2012
Unconfirmed bearish trend
Hate to say it, but it doesn't look promising
In today's post, I'll examine a couple leading indicators and chart patterns that are making me lean toward a bearish trend for the next 10-20 trading days.

First leading bearish indicator is the RumWave itself. It is on the verge of tripping a sell signal on a confirmed downtrend. I think a down day tomorrow would trigger it. If we get a little bounce tomorrow, we may stay above the trigger for a little bit longer. However the next couple charts tell a good story.

The chart above is from http://www.forexpros.com/analysis/3-peaks-and-domed-house-point-down-for-the-s-p-500-128816. The author points out that this pattern appeared "1893 to 1895, 1910 to 1912, 1946 to 1948, 1964 to 1968 and then 1966 to 1969." She goes on to count the waves for us and they are eerily similar. Right now we are at wave 27, and are poised for leg 28 which would be a big big downturn. I don't like it, but I have to acknowledge how similar the patterns are, and matched with the RumWave's prediction of a downturn it must be taken seriously.


The daily chart also shows some room for further decline with the red and purple lines of the slow stochastic about to cross.

Overall, I am looking forward to tomorrow to see if the RumWave confirms the downtrend or if we bounce back up and remain "above the line". Best of luck to your trading!
Sunday, July 8, 2012
QE3, what would you do?
Walk a mile in their shoes
It seems that the news media wants us to believe that market traders want another round of easing.. and they want it now. But, lets take a look at the concept from the eyes of Ben Bernanke and the rest of his staff. Here are six reasons I think QE3 is unlikely anytime soon.
1. Its really not that bad. The jobs numbers have been admittedly weak, but they're not end of the world bad like some news outlets (more specifically individual commentators) may lead us to believe.
2. The Fed just announced a continuation of "Operation Twist" through the end of the year. This is their current countermeasure for a slump in economic data. I can't imagine a sensible person that wouldn't think we should wait to see if this worked before throwing more cash into the market.
3. The stock market is not the economy. While in theory it should be a reflection of the economy, it just isn't really. And even if it was, the equity market it is doing just fine. We just had our annual swoon, and are moving back up. It seems like short term traders cry like toddlers in a grocery store anytime they don't get their way. They would do well to scale out their charts to a weekly (or greater) scale and review the "photo grande." Besides, I gotta think that as slow as the Fed moves, it is unlikely that they are interested in any short term gyrations in the markets.
4. The law of diminishing returns tells us that each round of easing will be less effective than the previous. Given this, the impact of adding liquidity to the market would probably be little more than a sugar rush for day traders. Besides, if you were a business owner, would QE3 make you want to hire people? Probably not by itself. What you would want is some serious policy changes. Those would only come with a changing of the guard in DC. So, if I was Ben, I'd probably just wait it out to see what happens in the election, saving the last bullet for a real disaster.
5. The Fiscal Cliff. What a doomsday event this thing is. Lets see.. if Obama wins the election the situation likely ends is a stalemate and we go off the cliff because our elected leaders tend act like children refusing to shake hands at the end of the little league game. If Romney wins, he won't be sworn in until January, which leaves the Battleship US drifting through murky economic waters without a leader able to affect change throughout November and December. That is when the ship drifts into the underwater mine of the Fiscal Cliff. This is the time we will need that last set of countermeasures from the Fed.
6. A race to devalue currency. I didn't really understand what this meant until I started reading a couple books written by gold bugs. The ah-ha moment came when I realized that when the value of our dollar goes down, the value of the objects I have, or want to have, goes up in US dollar terms. For example, lets say I'm a farmer selling a box of peaches for $10 USD. If the value of the USD declines, the $10 bill that would have bought my peaches is no longer equal to the peaches' value. Now, my peaches are worth, lets just say, $12 USD. The same is true of your "stock certificates". When the USD declines, it requires more money, in US dollar terms, to equal the value of your shares of stock. This gives you the illusion that your stock is worth more. In actuality, if you compared the value of your stock to another commodity, lets just say gold, the value of the stock priced in equivalent grams of gold probably wouldn't change unless the actual value of the goods changed. Multiply that concept across the entire equity market and, voila, the market goes up when money is injected and the USD devalued. Your stock isn't really worth more, but the numbers trick you into believing it is. So, over the last couple years the USD has been plummeting while the Euro and price of gold has been increasing. Now the Euro is on the decline because of their ongoing financial saga. So adding more cash into the market effectively causes us to race the world to the bottom. What happens when the get there? I honestly don't know, but I don't think it will be pretty.
All these reasons give me no reason to expect QE3 through the rest of this year. Good luck this week!
Friday, July 6, 2012
Celebrate victories, then get back to work
Might flop around a bit, but will go back up

Today's action was as expected. We got the whoosh I had been talking about. I quickly secured profits because I don't think this will be a sustained downtrend. Rather, I see it as a Wave 4 from an Elliot Wave perspective, so we should get another impulse higher before an intermediate term correction. I think today we saw an A & B leg of wave 4, and should expect a C leg sideways or down Monday. If we get it, I'll look to re-enter my long positions late Monday or mid day Tuesday for the RumWave and UltraWave.

The scores above got the relief they needed, but the RumWave score is still very high. I'd like to see the 4 hr score get back into some sort of green range before re-committing to the long side.
 |
| DJIA 1 Hr |
The chart above is for learning purposes. It is a 1 hr chart of the DJIA. It clearly displayed a bearish divergence going into today's selloff. It is highlighted on the candlesticks and the RSI with a big red line. This one stood out really well, so it added to my confidence in today's expected decline.
 |
| DJIA 4 Hr Chart |
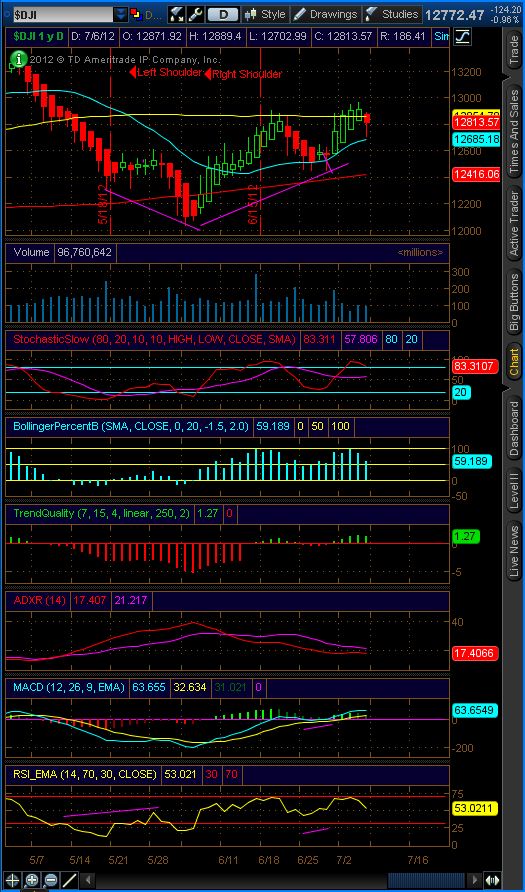
The 4 hr chart candlesticks indicate a strong push to the downside that isn't done yet. We also see a bearish cross of red & purple lines on the Slow Stochastic.
 |
| DJIA Daily Chart |
The Daily chart supports the case that there is more room to the downside. How much more is yet to be determined.
If you are still reading this far down, thanks! You may have noticed my sponsor's ads on the page. If you like the information in this blog, you will probably like those particular products (they are targeted at you!). It may be worth checking out a link or two! (Full disclosure: I get a little kickback if you click on them :)
Best of luck to your trading next week!
Subscribe to:
Posts (Atom)
Get Market Condition Change ALERTS.. FOR FREE! Subscribe To RUM Wave Posts!


 Posts
All Comments
Posts
All Comments