Friday, July 6, 2012

Celebrate victories, then get back to work


Might flop around a bit, but will go back up


Today's action was as expected.  We got the whoosh I had been talking about.  I quickly secured profits because I don't think this will be a sustained downtrend.  Rather, I see it as a Wave 4 from an Elliot Wave perspective, so we should get another impulse higher before an intermediate term correction.  I think today we saw an A & B leg of wave 4, and should expect a C leg sideways or down Monday.  If we get it, I'll look to re-enter my long positions late Monday or mid day Tuesday for the RumWave and UltraWave.


The scores above got the relief they needed, but the RumWave score is still very high.  I'd like to see the 4 hr score get back into some sort of green range before re-committing to the long side.


DJIA 1 Hr

The chart above is for learning purposes.  It is a 1 hr chart of the DJIA.  It clearly displayed a bearish divergence going into today's selloff.  It is highlighted on the candlesticks and the RSI with a big red line.  This one stood out really well, so it added to my confidence in today's expected decline.

DJIA 4 Hr Chart

The 4 hr chart candlesticks indicate a strong push to the downside that isn't done yet.  We also see a bearish cross of red & purple lines on the Slow Stochastic.
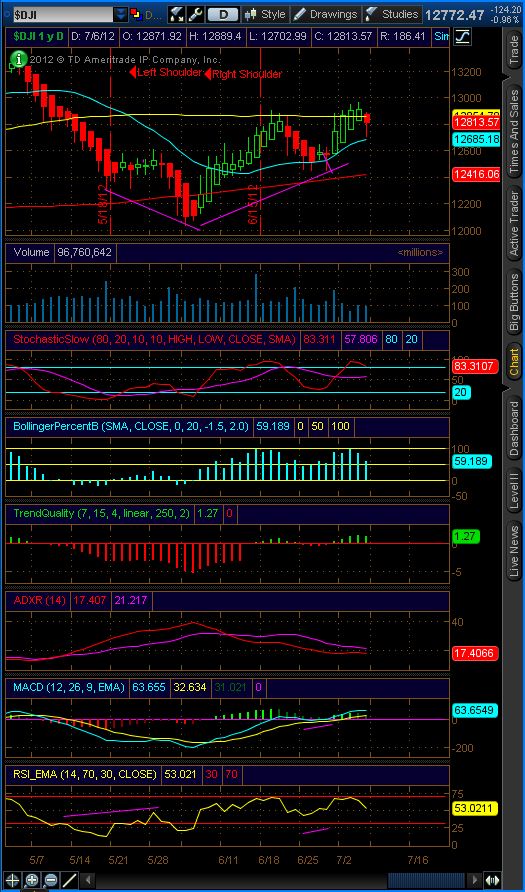
DJIA Daily Chart

The Daily chart supports the case that there is more room to the downside.  How much more is yet to be determined.

If you are still reading this far down, thanks!  You may have noticed my sponsor's ads on the page.  If you like the information in this blog, you will probably like those particular products (they are targeted at you!).  It may be worth checking out a link or two! (Full disclosure:  I get a little kickback if you click on them :)

Best of luck to your trading next week!


Whoosh!

Thursday, July 5, 2012

Get your popcorn ready..

The writing is on the wall


Today's action was a good set up for a big move in the next couple trading sessions.  The EUR/USD got hammered and the market seemed to not pay much attention.  On a different non-holiday weekday I think the averages would have seen annihilation.  Some news tomorrow morning may be the catalyst to move us substantially lower and relieve some of the pressure on the scores shown below.  Something to remember is that some of the gains during the most recent impulse were "speculation for future Fed easing."  If the numbers reported are "good" then that should be "bad" for the Fed junkies.

Daily Scores

DJIA 4 hr Chart

The 4 hr chart looks like it is completing the "twisted ribbon" on this impulse.  I've also turned on a bunch of other oscillators for analysis.  I'm keeping a special eye out for bearish and bullish divergences.  Big thanks to a friend (and regular reader) for recommending that!

DJIA Daily Chart

The daily is somewhat unremarkable, but I do note that the RSI is reaching it's highest levels in a while.

Best of luck to your trading!

Good opportunity today

Get ready for the woosh

I just happen to be home today, so I thought I'd throw out a quick intraday update.  I'm loading up on shorts because today seems to be setting us up for a big woosh down.  I just ran the scores for the day and although they will changes as the day goes on, I'm still expecting a decline for the next little bit.  More to follow this evening!  

Tuesday, July 3, 2012

RumWave is very high

Extreme caution warranted

Today the market moved still higher on a short trading day.  As a result, the daily score of the RumWave is, literally, off the chart.  It is higher than it has been since I've been keeping track of scores and it far surpassed my benchmark for a pivotal high.


The internal components of today's scores included lots of pink and red numbers.  The last time this happened I stated on this blog that such internal numbers should have been a red flag indicating a imminent decline.  This time I took it to heart and put a 3x short position on the UltraWave near the end of the trading day.  I intend this to be a very short hold period, likely 2 trading days or less.  

As a method, the RumWave is intended to be a much less volatile trading mechanism.  The intent is for followers to be able to check the blog once a day and have a good idea about how to position themselves for the next 10-20 trading days.  It is not intended to be a 1-2 day holding mechanism, however the numbers today just seemed too high to let the opportunity pass without action.  I think a couple red candlesticks are in order, and then we will resume the bullish push.

DJIA 4 Hr Chart
The candlesticks on the 4 hr chart (above) continue to compress while the red line on the slow stochastic remains high and the purple line is reaching higher points.  %B is relatively high, but not super high.  The MACD is still looking positive without signs of collapse, but it is a lagging indicator which is why it's not my favorite.

The daily chart below shows the slow stochastic at high levels.  The %B is also high.  This tells me we are up against some natural resistance from a reversion to the mean perspective.


DJIA Daily Chart


So, the bottom line is that the RumWave is waiting for an opportunity to buy while the UltraWave has taken a short position in anticipation of an imminent decline.   

Monday, July 2, 2012

All cash for now

Sitting in cash for now

First, thanks to all of you for propelling this blog past 1,000 page views!  I'm humbled by the response to this blog in the short amount of time it has been in the public view.  I hope everyone finds it helpful in their trading.. if you find it useful, please pass it on to your friends!

Now, on to business.  You probably noticed I am now keeping two scoreboards.  One for the RumWave and one for the UltraWave.   To review, the RumWave is the less risky of the two, and the UltraWave incorporates short positions.   Today I exited the 3x short position for the UltraWave.  Right now I'm recommending a HOLD status.  While I do think the intermediate term (6 months or so) is likely to be higher, I just don't like the daily scores here.


Today I've posted a larger view of the scores.  You can see how they have progressed since the most recent low on 26 Jun.  Right now, the score colors are decidedly orange and red, so I'm not looking for a big bullish run in the very short term (next few days).  

While I do have concerns about missing a prolonged rally, I also bare in mind that this method is totally crushing most funds.  According to http://money.cnn.com/magazines/moneymag/bestfunds/ the top managed funds' YTD performance is significantly lower than the RumWave with the best being at 18%, and most of them seem to be in the 4-5% range.  (nearest I can tell this is current as of 4pm  EST).  So, in theory, we could buy an ETF that mirrors the DJIA, take a vacation for the rest of the year and still be crushing it.  Ultimately, I plan on letting the market cool down a bit before jumping back in.  The 4th of July holiday would be a great time to announce some terrible news because most of us will be grilling burgers and hot dogs, not paying attention to the headlines


DJIA 4 hr chart
 The 4 hr chart is showing a bit of weakness here, with the red line on the slow stochastic taking a slight downward slope an the candlesticks starting to take that "twisted ribbon" appearance.  Not a totally bad sign, but showing some consolidation at a minimum.

DJIA Daily Chart
 The daily is also in no-man's land.  There's the big fat candle for today, but the top of that candle is in line with the previous candle's high and also matching with the last level of resistance from 20 Jun.


The bottom line is that we're just going to play it cool here, enjoy the 4th, and let the market come to us.  HAVE A GREAT TUESDAY!!

Sunday, July 1, 2012

30,000 foot view of the market

Lets look at the forest, not just the trees

I thought this might be a good time to look at the bigger picture for a minute before we go into the 3rd quarter Monday.  Overall, I think the correction we've endured the last couple months has ended and we are headed back up.

DJIA Weekly chart

DJIA Weekly Score
The chart speaks volumes to where we are.  We are seeing green candlesticks after the most recent decline, the slow stochastic is bullish with room to move higher, %B is relatively low, trend quality indicator is starting to show green, and the MACD is well positioned to cross over and start going uphill.  The weekly score, from my proprietary score generator, is mid range.  It usually bottoms out around 30-50 and can go as high as 250 at peaks.

Combining these facts with the knowledge that my favorite Elliot Wave counter has also come to the same conclusion, I feel good about our prospects for the rest of the year.  Longer term investors could probably get in here and be happy come December... as long as that whole fiscal cliff thing gets taken care of.

Here's wishing everyone a successful second half!